Cisco 2005 Annual Report Download - page 29
Download and view the complete annual report
Please find page 29 of the 2005 Cisco annual report below. You can navigate through the pages in the report by either clicking on the pages listed below, or by using the keyword search tool below to find specific information within the annual report.-
 1
1 -
2
-
3
-
4
-
5
-
6
-
7
-
8
-
9
-
10
-
11
-
12
-
13
-
14
-
15
-
16
-
17
-
18
-
 19
19 -
 20
20 -
 21
21 -
 22
22 -
 23
23 -
 24
24 -
 25
25 -
 26
26 -
 27
27 -
 28
28 -
 29
29 -
 30
30 -
 31
31 -
 32
32 -
 33
33 -
 34
34 -
 35
35 -
 36
36 -
 37
37 -
 38
38 -
 39
39 -
40
-
41
-
42
-
43
-
44
-
45
-
46
-
47
-
48
-
49
-
50
-
51
-
52
-
53
-
54
-
55
-
56
-
57
-
58
-
59
-
60
-
61
-
62
-
63
-
64
-
65
-
66
-
67
-
68
-
69
-
70
-
71
 |
 |

32
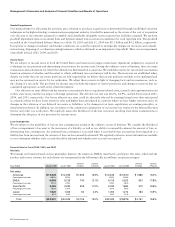
Sales and marketing expenses increased primarily due to increases in sales expenses of $270 million and marketing expenses of
$144 million. The increase in sales expenses was primarily due to the effect of foreign currency fluctuations, net of hedging, of
approximately $120 million, and an increase in sales commissions of approximately $110 million partially offset by a decrease
in sales program expenses of $86 million. The remaining increase was primarily due to higher discretionary spending. The increase
in marketing expenses was primarily related to an increase of $66 million in our integrated marketing campaign. The increase in
marketing expenses was also attributable to additional expenses of $33 million related to our acquisition of the Linksys business in
the fourth quarter of fiscal 2003. In May 2004, we announced plans to increase the size of our sales force.
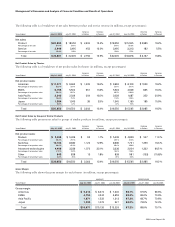
G&A expenses increased primarily due to higher amortization of deferred stock-based compensation of $52 million attributable
to our acquisitions, expenses related to investments in internal information technology systems and related program spending of
$42 million, and the effect of foreign currency fluctuations, net of hedging, of approximately $30 million.
Amortization of Purchased Intangible Assets
Amortization of purchased intangible assets included in operating expenses was $242 million in fiscal 2004, compared with $394 million
in fiscal 2003. The decrease in the amortization of purchased intangible assets was due to the amortization of certain technology and
patent intangibles in the prior year period that were fully amortized as of the end of fiscal 2003. For additional information regarding
purchased intangible assets, see Note 3 to the Consolidated Financial Statements.
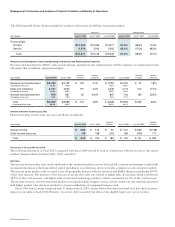
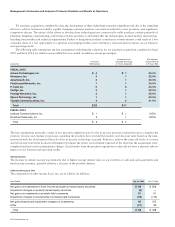
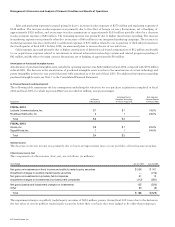
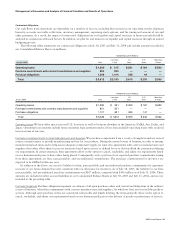
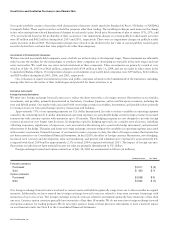
In-Process Research and Development
The following table summarizes the key assumptions underlying the valuation for our purchase acquisitions completed in fiscal
2004 and fiscal 2003, for which in-process R&D was recorded (in millions, except percentages):
FISCAL 2004
FISCAL 2003
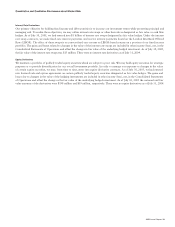
Interest Income
The decrease in interest income was primarily due to lower average interest rates on our portfolio of fixed income securities.
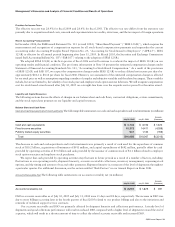
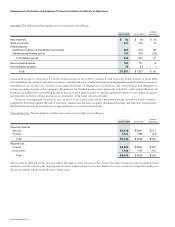
Other Income (Loss), Net
The components of other income (loss), net, are as follows (in millions):
The impairment charges on publicly traded equity securities of $412 million, pretax, during fiscal 2003 were due to the decline in
the fair value of certain publicly traded equity securities below their cost basis that were judged to be other-than-temporary.
Management’s Discussion and Analysis of Financial Condition and Results of Operations