Cisco 2005 Annual Report Download - page 20
Download and view the complete annual report
Please find page 20 of the 2005 Cisco annual report below. You can navigate through the pages in the report by either clicking on the pages listed below, or by using the keyword search tool below to find specific information within the annual report.-
 1
1 -
2
-
3
-
4
-
5
-
6
-
7
-
8
-
9
-
 10
10 -
 11
11 -
 12
12 -
 13
13 -
 14
14 -
 15
15 -
 16
16 -
 17
17 -
 18
18 -
 19
19 -
 20
20 -
 21
21 -
 22
22 -
 23
23 -
 24
24 -
 25
25 -
 26
26 -
 27
27 -
 28
28 -
 29
29 -
 30
30 -
31
-
32
-
33
-
34
-
35
-
36
-
37
-
38
-
39
-
40
-
41
-
42
-
43
-
44
-
45
-
46
-
47
-
48
-
49
-
50
-
51
-
52
-
53
-
54
-
55
-
56
-
57
-
58
-
59
-
60
-
61
-
62
-
63
-
64
-
65
-
66
-
67
-
68
-
69
-
70
-
71
 |
 |
23
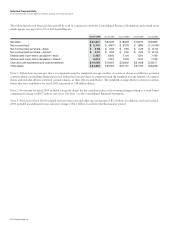
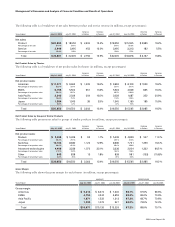
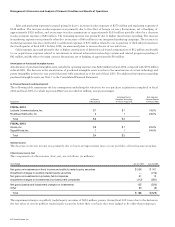
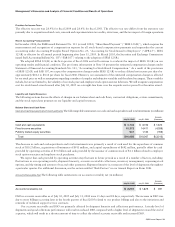
The following table is a breakdown of net sales between product and service revenue (in millions, except percentages):
July 30, 2005
$ 20,853
Percentage of net sales 84.1% 84.1% 84.1% 82.5%
3,948
Percentage of net sales 15.9% 15.9% 15.9% 17.5%
$ 24,801
Net Product Sales by Theater
The following table is a breakdown of net product sales by theater (in millions, except percentages):
July 30, 2005
$ 11,071
Percentage of net product sales 53.1% 52.1% 52.1% 52.1%
6,155
Percentage of net product sales 29.5% 29.7% 29.7% 29.6%
2,243
Percentage of net product sales 10.8% 11.0% 11.0% 10.8%
1,384
Percentage of net product sales 6.6% 7.2% 7.2% 7.5%
$ 20,853
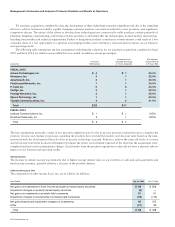
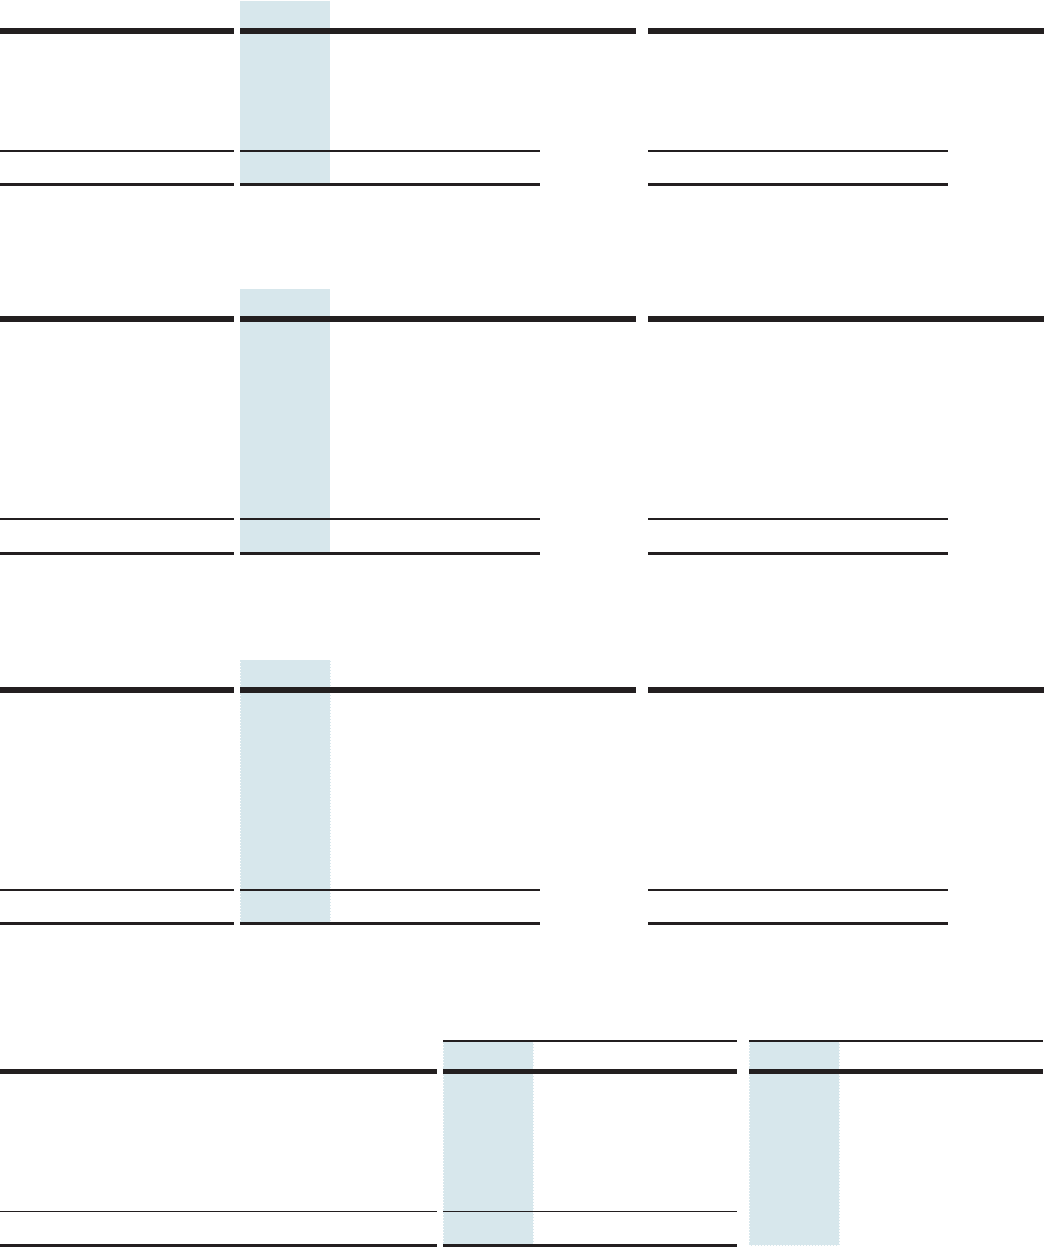
Net Product Sales by Groups of Similar Products
The following table presents net sales for groups of similar products (in millions, except percentages):
July 30, 2005
$ 5,498
Percentage of net product sales 26.4% 29.1% 29.1% 31.2%
10,104
Percentage of net product sales 48.5% 48.4% 48.4% 49.6%
4,408
Percentage of net product sales 21.1% 18.0% 18.0% 12.9%
843
Percentage of net product sales 4.0% 4.5% 4.5% 6.3%
$ 20,853
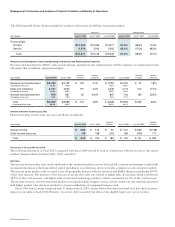
Gross Margin
The following table shows the gross margin for each theater (in millions, except percentages):
July 30, 2005 July 30, 2005
$ 9,213 66.1%
4,754 69.2%
1,671 67.2%
1,033 68.0%
$ 16,671 67.2%
Management’s Discussion and Analysis of Financial Condition and Results of Operations