Cisco 2005 Annual Report Download - page 31
Download and view the complete annual report
Please find page 31 of the 2005 Cisco annual report below. You can navigate through the pages in the report by either clicking on the pages listed below, or by using the keyword search tool below to find specific information within the annual report.-
 1
1 -
2
-
3
-
4
-
5
-
6
-
7
-
8
-
9
-
10
-
11
-
12
-
13
-
14
-
15
-
16
-
17
-
18
-
19
-
20
-
 21
21 -
 22
22 -
 23
23 -
 24
24 -
 25
25 -
 26
26 -
 27
27 -
 28
28 -
 29
29 -
 30
30 -
 31
31 -
 32
32 -
 33
33 -
 34
34 -
 35
35 -
 36
36 -
 37
37 -
 38
38 -
 39
39 -
 40
40 -
 41
41 -
42
-
43
-
44
-
45
-
46
-
47
-
48
-
49
-
50
-
51
-
52
-
53
-
54
-
55
-
56
-
57
-
58
-
59
-
60
-
61
-
62
-
63
-
64
-
65
-
66
-
67
-
68
-
69
-
70
-
71
 |
 |
34
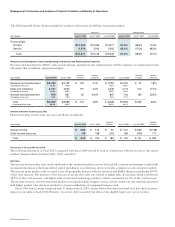
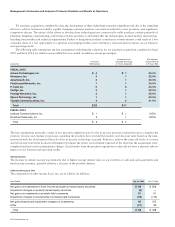
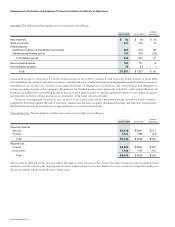
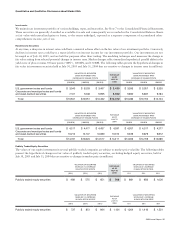
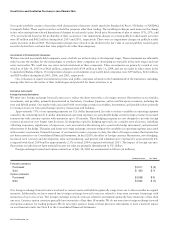
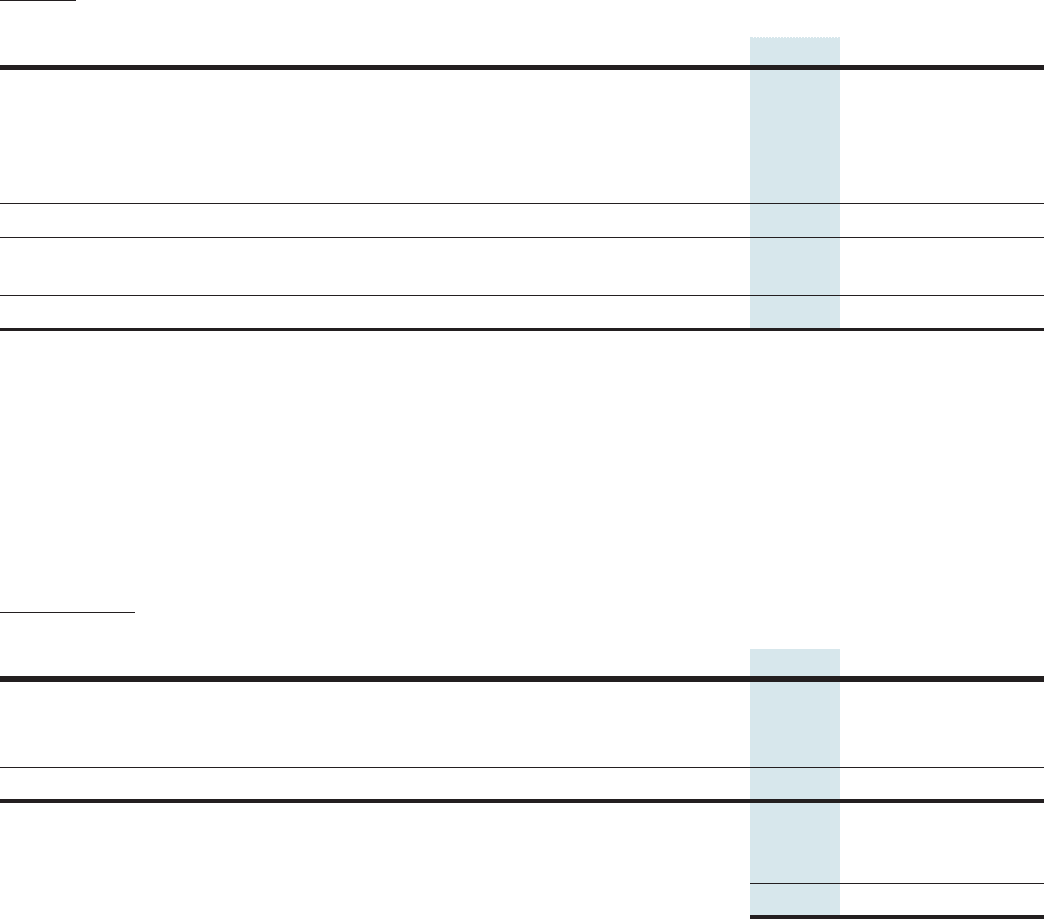
Inventories The following table summarizes our inventories (in millions):
July 30, 2005
$ 82
431
385
184
569
180
35
$ 1,297
Annualized inventory turns were 6.6 in the fourth quarter of fiscal 2005, compared with 6.4 in the fourth quarter of fiscal 2004.
Our finished goods consist of distributor inventory and deferred costs of sales and manufacturing finished goods. Distributor inventory
and deferred cost of sales are related to unrecognized revenue on shipments to distributors and retail partners and shipments to
enterprise and service provider customers. Manufacturing finished goods consist primarily of build-to-order and build-to-stock
products, including home networking products. Service-related spares consist of reusable equipment related to our technical support
and warranty activities. All inventories are accounted for at the lower of cost or market.
Inventory management remains an area of focus as we balance the need to maintain strategic inventory levels to ensure
competitive lead times against the risk of inventory obsolescence because of rapidly changing technology and customer requirements.
We believe the amount of our inventory is appropriate for our current revenue levels.
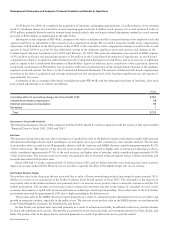
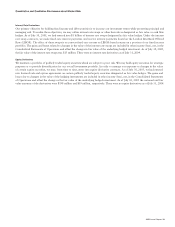
Deferred Revenue The breakdown of deferred revenue was as follows (in millions):
July 30, 2005
$ 3,618
1,424
$ 5,042
$ 3,854
1,188
$ 5,042
The increase in deferred service revenue reflects the impact of the increase in the volume of technical support contract initiations and
renewals, partially offset by the ongoing amortization of deferred service revenue. Deferred service revenue is recognized ratably over
the service period, which is typically one to three years.
Management’s Discussion and Analysis of Financial Condition and Results of Operations