Chrysler 2007 Annual Report Download - page 99
Download and view the complete annual report
Please find page 99 of the 2007 Chrysler annual report below. You can navigate through the pages in the report by either clicking on the pages listed below, or by using the keyword search tool below to find specific information within the annual report.-
 1
1 -
2
-
3
-
4
-
5
-
6
-
7
-
8
-
9
-
10
-
11
-
12
-
13
-
14
-
15
-
16
-
17
-
18
-
19
-
20
-
21
-
22
-
23
-
24
-
25
-
26
-
27
-
28
-
29
-
30
-
31
-
32
-
33
-
34
-
35
-
36
-
37
-
38
-
39
-
40
-
41
-
42
-
43
-
44
-
45
-
46
-
47
-
48
-
49
-
50
-
51
-
52
-
53
-
54
-
55
-
56
-
57
-
58
-
59
-
60
-
61
-
62
-
63
-
64
-
65
-
66
-
67
-
68
-
69
-
70
-
71
-
72
-
73
-
74
-
75
-
76
-
77
-
78
-
79
-
80
-
81
-
82
-
83
-
84
-
85
-
86
-
87
-
88
-
 89
89 -
 90
90 -
 91
91 -
 92
92 -
 93
93 -
 94
94 -
 95
95 -
 96
96 -
 97
97 -
 98
98 -
 99
99 -
 100
100 -
 101
101 -
 102
102 -
 103
103 -
 104
104 -
 105
105 -
 106
106 -
 107
107 -
 108
108 -
 109
109 -
110
-
111
-
112
-
113
-
114
-
115
-
116
-
117
-
118
-
119
-
120
-
121
-
122
-
123
-
124
-
125
-
126
-
127
-
128
-
129
-
130
-
131
-
132
-
133
-
134
-
135
-
136
-
137
-
138
-
139
-
140
-
141
-
142
-
143
-
144
-
145
-
146
-
147
-
148
-
149
-
150
-
151
-
152
-
153
-
154
-
155
-
156
-
157
-
158
-
159
-
160
-
161
-
162
-
163
-
164
-
165
-
166
-
167
-
168
-
169
-
170
-
171
-
172
-
173
-
174
-
175
-
176
-
177
-
178
-
179
-
180
-
181
-
182
-
183
-
184
-
185
-
186
-
187
-
188
-
189
-
190
-
191
-
192
-
193
-
194
-
195
-
196
-
197
-
198
-
199
-
200
-
201
-
202
-
203
-
204
-
205
-
206
-
207
-
208
-
209
-
210
-
211
-
212
-
213
-
214
-
215
-
216
-
217
-
218
-
219
-
220
-
221
-
222
-
223
-
224
-
225
-
226
-
227
-
228
-
229
-
230
-
231
-
232
-
233
-
234
-
235
-
236
-
237
-
238
-
239
-
240
-
241
-
242
-
243
-
244
-
245
-
246
-
247
-
248
-
249
-
250
-
251
-
252
-
253
-
254
-
255
-
256
-
257
-
258
-
259
-
260
-
261
-
262
-
263
-
264
-
265
-
266
-
267
-
268
-
269
-
270
-
271
-
272
-
273
-
274
-
275
-
276
-
277
-
278
-
279
-
280
-
281
-
282
-
283
-
284
-
285
-
286
-
287
-
288
-
289
-
290
-
291
-
292
-
293
-
294
-
295
-
296
-
297
-
298
-
299
-
300
-
301
-
302
-
303
-
304
-
305
-
306
-
307
-
308
-
309
-
310
-
311
-
312
-
313
-
314
-
315
-
316
-
317
-
318
-
319
-
320
-
321
-
322
-
323
-
324
-
325
-
326
-
327
-
328
-
329
-
330
-
331
-
332
-
333
-
334
-
335
-
336
-
337
-
338
-
339
-
340
-
341
 |
 |

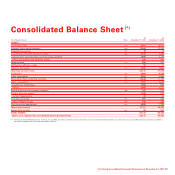
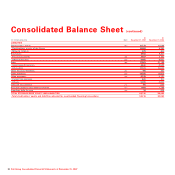
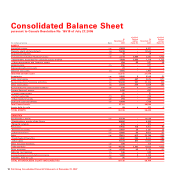
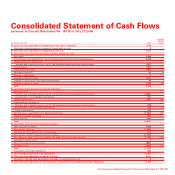
Consolidated Balance Sheet
pursuant to Consob Resolution No. 15519 of July 27, 2006
of which of which
At Related At Related
December 31, parties December 31, parties
(in millions of euros) Note 2007 (Note 35) 2007 (Note 35)
ASSETS
Intangible assets (13) 6,523 – 6,421 –
Property, plant and equipment (14) 11,246 – 10,540 –
Investment property (15) 10 –19 –
Investments and other financial assets: (16) 2,214 1,994 2,280 1,777
- Investments accounted for using the equity method 1,930 1,930 1,719 1,719
- Other investments and financial assets 284 64 561 58
Leased assets (17) 396 – 247 –
Defined benefit plan assets 31 –11 –
Deferred tax assets (11) 1,892 – 1,860 –
Total Non-current assets 22,312 21,378
Inventories (18) 9,990 6 8,548 25
Trade receivables (19) 4,384 367 4,944 377
Receivables from financing activities (19) 12,268 331 11 , 7 4 3 19 1
Other receivables: (19) 3,203 204 2,839 145
Accrued income and prepaid expenses (20) 241 1 247 –
Current financial assets: 1,016 – 637 –
- Current investments 22 –31 –
- Current securities (21) 291 – 224 –
- Other financial assets (22) 703 – 382 –
Cash and cash equivalents (23) 6,639 – 7,736 –
Total Current assets 37,741 36,694
Assets held for sale (24) 83 4 332 5
TOTAL ASSETS 60,136 58,404
LIABILITIES
Stockholders' equity: (25) 11,279 – 10,036 –
- Stockholders' equity of the Group 10,606 – 9,362 –
- Minority interest 673 –674 –
Provisions: 8,562 115 8,611 85
- Employee benefits (26) 3,597 25 3,761 18
- Other provisions (27) 4,965 90 4,850 67
Debt: (28) 17,951 617 20,188 734
- Asset-backed financing 6,820 296 8,344 396
- Other debt 11,131 321 11,844 338
Other financial liabilities (22) 188 –105 –
Trade payables (29) 14,725 1,107 12,603 1,005
Other payables (30) 6,120 46 5,120 51
Deferred tax liabilities (11) 193 – 263 –
Accrued expenses and deferred income (31) 1,083 4 1,169 –
Liabilities held for sale (24) 35 – 309 –
TOTAL STOCKHOLDERS' EQUITY AND LIABILITIES 60,136 58,404
Fiat Group Consolidated Financial Statements at December 31, 200798