Chrysler 2007 Annual Report Download - page 12
Download and view the complete annual report
Please find page 12 of the 2007 Chrysler annual report below. You can navigate through the pages in the report by either clicking on the pages listed below, or by using the keyword search tool below to find specific information within the annual report.-
 1
1 -
 2
2 -
 3
3 -
 4
4 -
 5
5 -
 6
6 -
 7
7 -
 8
8 -
 9
9 -
 10
10 -
 11
11 -
 12
12 -
 13
13 -
 14
14 -
 15
15 -
 16
16 -
 17
17 -
 18
18 -
 19
19 -
 20
20 -
 21
21 -
 22
22 -
23
-
24
-
25
-
26
-
27
-
28
-
29
-
30
-
31
-
32
-
33
-
34
-
35
-
36
-
37
-
38
-
39
-
40
-
41
-
42
-
43
-
44
-
45
-
46
-
47
-
48
-
49
-
50
-
51
-
52
-
53
-
54
-
55
-
56
-
57
-
58
-
59
-
60
-
61
-
62
-
63
-
64
-
65
-
66
-
67
-
68
-
69
-
70
-
71
-
72
-
73
-
74
-
75
-
76
-
77
-
78
-
79
-
80
-
81
-
82
-
83
-
84
-
85
-
86
-
87
-
88
-
89
-
90
-
91
-
92
-
93
-
94
-
95
-
96
-
97
-
98
-
99
-
100
-
101
-
102
-
103
-
104
-
105
-
106
-
107
-
108
-
109
-
110
-
111
-
112
-
113
-
114
-
115
-
116
-
117
-
118
-
119
-
120
-
121
-
122
-
123
-
124
-
125
-
126
-
127
-
128
-
129
-
130
-
131
-
132
-
133
-
134
-
135
-
136
-
137
-
138
-
139
-
140
-
141
-
142
-
143
-
144
-
145
-
146
-
147
-
148
-
149
-
150
-
151
-
152
-
153
-
154
-
155
-
156
-
157
-
158
-
159
-
160
-
161
-
162
-
163
-
164
-
165
-
166
-
167
-
168
-
169
-
170
-
171
-
172
-
173
-
174
-
175
-
176
-
177
-
178
-
179
-
180
-
181
-
182
-
183
-
184
-
185
-
186
-
187
-
188
-
189
-
190
-
191
-
192
-
193
-
194
-
195
-
196
-
197
-
198
-
199
-
200
-
201
-
202
-
203
-
204
-
205
-
206
-
207
-
208
-
209
-
210
-
211
-
212
-
213
-
214
-
215
-
216
-
217
-
218
-
219
-
220
-
221
-
222
-
223
-
224
-
225
-
226
-
227
-
228
-
229
-
230
-
231
-
232
-
233
-
234
-
235
-
236
-
237
-
238
-
239
-
240
-
241
-
242
-
243
-
244
-
245
-
246
-
247
-
248
-
249
-
250
-
251
-
252
-
253
-
254
-
255
-
256
-
257
-
258
-
259
-
260
-
261
-
262
-
263
-
264
-
265
-
266
-
267
-
268
-
269
-
270
-
271
-
272
-
273
-
274
-
275
-
276
-
277
-
278
-
279
-
280
-
281
-
282
-
283
-
284
-
285
-
286
-
287
-
288
-
289
-
290
-
291
-
292
-
293
-
294
-
295
-
296
-
297
-
298
-
299
-
300
-
301
-
302
-
303
-
304
-
305
-
306
-
307
-
308
-
309
-
310
-
311
-
312
-
313
-
314
-
315
-
316
-
317
-
318
-
319
-
320
-
321
-
322
-
323
-
324
-
325
-
326
-
327
-
328
-
329
-
330
-
331
-
332
-
333
-
334
-
335
-
336
-
337
-
338
-
339
-
340
-
341
 |
 |

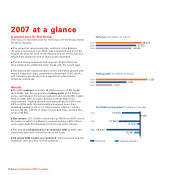
Report on Operations 2007 at a glance 11
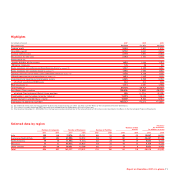
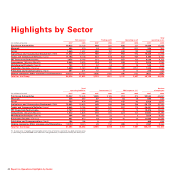
Highlights
(in millions of euros) 2007 2006 2005
Net revenues 58,529 51,832 46,544
Trading profit 3,233 1,951 1,000
Operating result 3,152 2,061 2,215
Income before taxes 2,773 1,641 2,264
Net income for the year 2,054 1,151 1,420
Attributable to:
- Equity holders of the parent 1,953 1,065 1,331
- Minority interests 101 86 89
Basic earnings per ordinary and preference share (in euros) (1) 1.537 0.789 1.250
Basic earnings per savings share (in euros) (1) 1.692 1.564 1.250
Diluted earnings per ordinary and preference share (in euros) (1) 1.526 0.788 1.250
Diluted earnings per savings share (in euros) (1) 1.681 1.563 1.250
Investments in tangible and intangible assets 3,985 3,789 3,052
of which: capitalised R&D costs 932 813 656
R&D expenses (2) 1,741 1,591 1,558
Total Assets (3) 60,136 58,404 62,454
Net (Debt)/ Cash position (10,423) (11,836) (18,523)
of which: Net industrial (Debt)/ Cash position 355 (1,773) (3,219)
Stockholders’ equity before minority interest 11,279 10,036 9,413
Group interest in stockholders’ equity 10,606 9,362 8,681
Employees at year-end (number) 185,227 172,012 173,695
(1) For additional information on the calculation of basic and diluted earnings per share see Note 12 of the Notes to the Consolidated Financial Statements.
(2) This amount includes capitalised R&D costs and costs charged directly to operations during the fiscal year.
(3) Total Assets at December 31, 2006 differ from the figure previously published due to the reclassification of 101 million euros described in the Notes to the Consolidated Financial Statements.
Selected data by region
2007 2006 2007 2006 2007 2006 2007 2006 2007 2006
Italy 162 146 77,679 75,751 56 52 49 50 15,857 14,851
Europe excluding Italy 281 285 45,999 42,904 54 56 32 32 23,461 20,298
North America 74 76 11,364 11 , 7 1 4 22 25 14 15 5,842 6,315
Mercosur 32 31 39,324 30,877 24 20 10 10 8,318 5,416
Other regions 111 99 10,861 10,766 22 27 995,051 4,952
Total 660 637 185,227 172,012 178 180 114 116 58,529 51,832
Number of Companies Number of Employees Number of Facilities
Number of R&D
Centres
Revenues
by destination
(in millions of euros)