Chrysler 2007 Annual Report Download - page 37
Download and view the complete annual report
Please find page 37 of the 2007 Chrysler annual report below. You can navigate through the pages in the report by either clicking on the pages listed below, or by using the keyword search tool below to find specific information within the annual report.-
 1
1 -
2
-
3
-
4
-
5
-
6
-
7
-
8
-
9
-
10
-
11
-
12
-
13
-
14
-
15
-
16
-
17
-
18
-
19
-
20
-
21
-
22
-
23
-
24
-
25
-
26
-
 27
27 -
 28
28 -
 29
29 -
 30
30 -
 31
31 -
 32
32 -
 33
33 -
 34
34 -
 35
35 -
 36
36 -
 37
37 -
 38
38 -
 39
39 -
 40
40 -
 41
41 -
 42
42 -
 43
43 -
 44
44 -
 45
45 -
 46
46 -
 47
47 -
48
-
49
-
50
-
51
-
52
-
53
-
54
-
55
-
56
-
57
-
58
-
59
-
60
-
61
-
62
-
63
-
64
-
65
-
66
-
67
-
68
-
69
-
70
-
71
-
72
-
73
-
74
-
75
-
76
-
77
-
78
-
79
-
80
-
81
-
82
-
83
-
84
-
85
-
86
-
87
-
88
-
89
-
90
-
91
-
92
-
93
-
94
-
95
-
96
-
97
-
98
-
99
-
100
-
101
-
102
-
103
-
104
-
105
-
106
-
107
-
108
-
109
-
110
-
111
-
112
-
113
-
114
-
115
-
116
-
117
-
118
-
119
-
120
-
121
-
122
-
123
-
124
-
125
-
126
-
127
-
128
-
129
-
130
-
131
-
132
-
133
-
134
-
135
-
136
-
137
-
138
-
139
-
140
-
141
-
142
-
143
-
144
-
145
-
146
-
147
-
148
-
149
-
150
-
151
-
152
-
153
-
154
-
155
-
156
-
157
-
158
-
159
-
160
-
161
-
162
-
163
-
164
-
165
-
166
-
167
-
168
-
169
-
170
-
171
-
172
-
173
-
174
-
175
-
176
-
177
-
178
-
179
-
180
-
181
-
182
-
183
-
184
-
185
-
186
-
187
-
188
-
189
-
190
-
191
-
192
-
193
-
194
-
195
-
196
-
197
-
198
-
199
-
200
-
201
-
202
-
203
-
204
-
205
-
206
-
207
-
208
-
209
-
210
-
211
-
212
-
213
-
214
-
215
-
216
-
217
-
218
-
219
-
220
-
221
-
222
-
223
-
224
-
225
-
226
-
227
-
228
-
229
-
230
-
231
-
232
-
233
-
234
-
235
-
236
-
237
-
238
-
239
-
240
-
241
-
242
-
243
-
244
-
245
-
246
-
247
-
248
-
249
-
250
-
251
-
252
-
253
-
254
-
255
-
256
-
257
-
258
-
259
-
260
-
261
-
262
-
263
-
264
-
265
-
266
-
267
-
268
-
269
-
270
-
271
-
272
-
273
-
274
-
275
-
276
-
277
-
278
-
279
-
280
-
281
-
282
-
283
-
284
-
285
-
286
-
287
-
288
-
289
-
290
-
291
-
292
-
293
-
294
-
295
-
296
-
297
-
298
-
299
-
300
-
301
-
302
-
303
-
304
-
305
-
306
-
307
-
308
-
309
-
310
-
311
-
312
-
313
-
314
-
315
-
316
-
317
-
318
-
319
-
320
-
321
-
322
-
323
-
324
-
325
-
326
-
327
-
328
-
329
-
330
-
331
-
332
-
333
-
334
-
335
-
336
-
337
-
338
-
339
-
340
-
341
 |
 |

Report on Operations Financial Review of the Group36
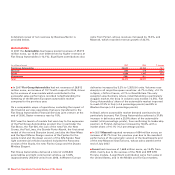
■Fiat Group Automobiles had a trading profit of 803 million
euros (3% of revenues) a sharp improvement (+512 million
euros) from the 291 million euros (1.2% of revenues) reported
in 2006. The increase is mainly attributable to higher volumes,
a more favourable product mix following the introduction of
new models, increased absorption of fixed production costs,
net of higher costs for research and development, advertising
and network development supporting intensive product
program and commercial strategy in both Western Europe and
Latin America. The contribution of a non-recurring gain (net of
non-recurring expenses) of approximately 65 million euros,
also positively impacted trading profit.
■In 2007 Maserati had a trading profit of 24 million euros
(3.5% of revenues), a sharp improvement (up 57 million euros)
from the loss of 33 million euros reported in 2006. Higher
volumes and cost-containment initiatives enabled Maserati to
report a positive trading result for the first time since its entry
into the Fiat Group in 1993.
■Ferrari closed 2007 with a trading profit of 266 million euros,
up 45.4% from 183 million euros in 2006. The improvement is
mainly attributable to higher sales volumes and efficiency
gains, offset in part by increased R&D expenses and
unfavorable US dollar exchange rate. Trading margin was
15.9% in 2007 against 12.6% in 2006.
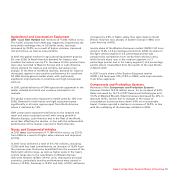
Agricultural and Construction Equipment
In 2007 CNH - Case New Holland had a trading profit of 990
million euros, representing a trading margin of 8.4%, up from
7% in 2006. The 253 million euro improvement (+34.3%; +46.7%
in US dollar terms) from the 737 million euros of 2006 was
mainly due to higher sales volumes, a more favourable mix
and pricing (allowing also the recovery of higher raw material
costs), as well as benefits deriving from improved product
quality.
Trucks and Commercial Vehicles
Iveco had a trading profit of 813 million euros (7.3% of
revenues), a sharp improvement (+267 million euros, or
+48.9%) over trading profit of 546 million euros in 2006 (6% of
revenues). The increase is mainly attributable to strong growth
in sales volume and better pricing resulting from the
competitive repositioning of its products, especially heavy
vehicles, partially offset by higher costs both for R&D and for
the international expansion initiatives started by Iveco over
the last 2 years.
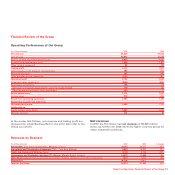
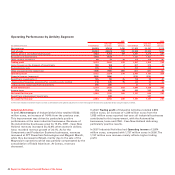
Components and Production Systems
The Components and Production Systems businesses posted
trading profit of 509 million euros, for a trading margin of 3.8%
(2.8% in 2006). The 161 million euro overall improvement
reflects higher trading profit at FPT Powertrain Technologies
and Magneti Marelli, and the reduced loss at Comau.
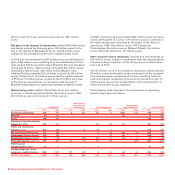
(in millions of euros) 2007 2006 Change
FPT Powertrain Technologies 271 168 103
Components (Magneti Marelli) 214 190 24
Metallurgical Products (Teksid) 47 56 -9
Production Systems (Comau) (23) (66) 43
Total 509 348 161
Trading margin (%) 3.8 2.8