Chrysler 2007 Annual Report Download - page 86
Download and view the complete annual report
Please find page 86 of the 2007 Chrysler annual report below. You can navigate through the pages in the report by either clicking on the pages listed below, or by using the keyword search tool below to find specific information within the annual report.-
 1
1 -
2
-
3
-
4
-
5
-
6
-
7
-
8
-
9
-
10
-
11
-
12
-
13
-
14
-
15
-
16
-
17
-
18
-
19
-
20
-
21
-
22
-
23
-
24
-
25
-
26
-
27
-
28
-
29
-
30
-
31
-
32
-
33
-
34
-
35
-
36
-
37
-
38
-
39
-
40
-
41
-
42
-
43
-
44
-
45
-
46
-
47
-
48
-
49
-
50
-
51
-
52
-
53
-
54
-
55
-
56
-
57
-
58
-
59
-
60
-
61
-
62
-
63
-
64
-
65
-
66
-
67
-
68
-
69
-
70
-
71
-
72
-
73
-
74
-
75
-
 76
76 -
 77
77 -
 78
78 -
 79
79 -
 80
80 -
 81
81 -
 82
82 -
 83
83 -
 84
84 -
 85
85 -
 86
86 -
 87
87 -
 88
88 -
 89
89 -
 90
90 -
 91
91 -
 92
92 -
 93
93 -
 94
94 -
 95
95 -
 96
96 -
97
-
98
-
99
-
100
-
101
-
102
-
103
-
104
-
105
-
106
-
107
-
108
-
109
-
110
-
111
-
112
-
113
-
114
-
115
-
116
-
117
-
118
-
119
-
120
-
121
-
122
-
123
-
124
-
125
-
126
-
127
-
128
-
129
-
130
-
131
-
132
-
133
-
134
-
135
-
136
-
137
-
138
-
139
-
140
-
141
-
142
-
143
-
144
-
145
-
146
-
147
-
148
-
149
-
150
-
151
-
152
-
153
-
154
-
155
-
156
-
157
-
158
-
159
-
160
-
161
-
162
-
163
-
164
-
165
-
166
-
167
-
168
-
169
-
170
-
171
-
172
-
173
-
174
-
175
-
176
-
177
-
178
-
179
-
180
-
181
-
182
-
183
-
184
-
185
-
186
-
187
-
188
-
189
-
190
-
191
-
192
-
193
-
194
-
195
-
196
-
197
-
198
-
199
-
200
-
201
-
202
-
203
-
204
-
205
-
206
-
207
-
208
-
209
-
210
-
211
-
212
-
213
-
214
-
215
-
216
-
217
-
218
-
219
-
220
-
221
-
222
-
223
-
224
-
225
-
226
-
227
-
228
-
229
-
230
-
231
-
232
-
233
-
234
-
235
-
236
-
237
-
238
-
239
-
240
-
241
-
242
-
243
-
244
-
245
-
246
-
247
-
248
-
249
-
250
-
251
-
252
-
253
-
254
-
255
-
256
-
257
-
258
-
259
-
260
-
261
-
262
-
263
-
264
-
265
-
266
-
267
-
268
-
269
-
270
-
271
-
272
-
273
-
274
-
275
-
276
-
277
-
278
-
279
-
280
-
281
-
282
-
283
-
284
-
285
-
286
-
287
-
288
-
289
-
290
-
291
-
292
-
293
-
294
-
295
-
296
-
297
-
298
-
299
-
300
-
301
-
302
-
303
-
304
-
305
-
306
-
307
-
308
-
309
-
310
-
311
-
312
-
313
-
314
-
315
-
316
-
317
-
318
-
319
-
320
-
321
-
322
-
323
-
324
-
325
-
326
-
327
-
328
-
329
-
330
-
331
-
332
-
333
-
334
-
335
-
336
-
337
-
338
-
339
-
340
-
341
 |
 |
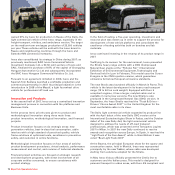
Difficult trading conditions negatively impacted Comau
revenues, which dropped by 14.9% from 2006. The decrease is
largely attributable to operations in North America, due in part
to the exchange rate, as well as the decisions taken as part of
the restructuring programme.
The plan to restructure and reshape the scope of the Sector’s
operations and its presence on the various markets, launched
at the end of 2006 to meet the challenge of slow markets,
continued in 2007, when it began to show its effects on the
Sector’s profitability by significantly reducing operating losses.
It is expected that the full benefits of the programme will be
achieved in 2008.
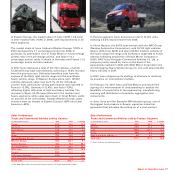
In a market that continued to show little improvement, order
intake totalled 1,180 million euros in 2007, in line with the
previous year.
In 2007, new orders for contract work came to 957 million
euros, in line with 2006. Overall, 62% of the orders for contract
work were acquired in Europe, 23% in the Nafta area, while the
remaining 15% came from the Mercosur and new markets (11%
in China). 39% of all orders came from Fiat Group companies
and 61% from other manufacturers. At December 31, 2007 the
order backlog totalled 582 million euros, down 2% from 2006.
For Service operations, in 2007 the 13% increase reported in
the Mercosur area was offset by the decline of 27% posted in
Europe, in line with the reshaping of the scope of the Sector’s
activities.
Report on Operations Comau 85
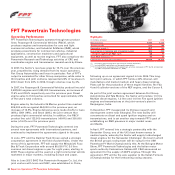
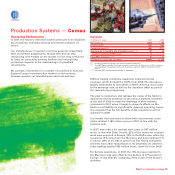
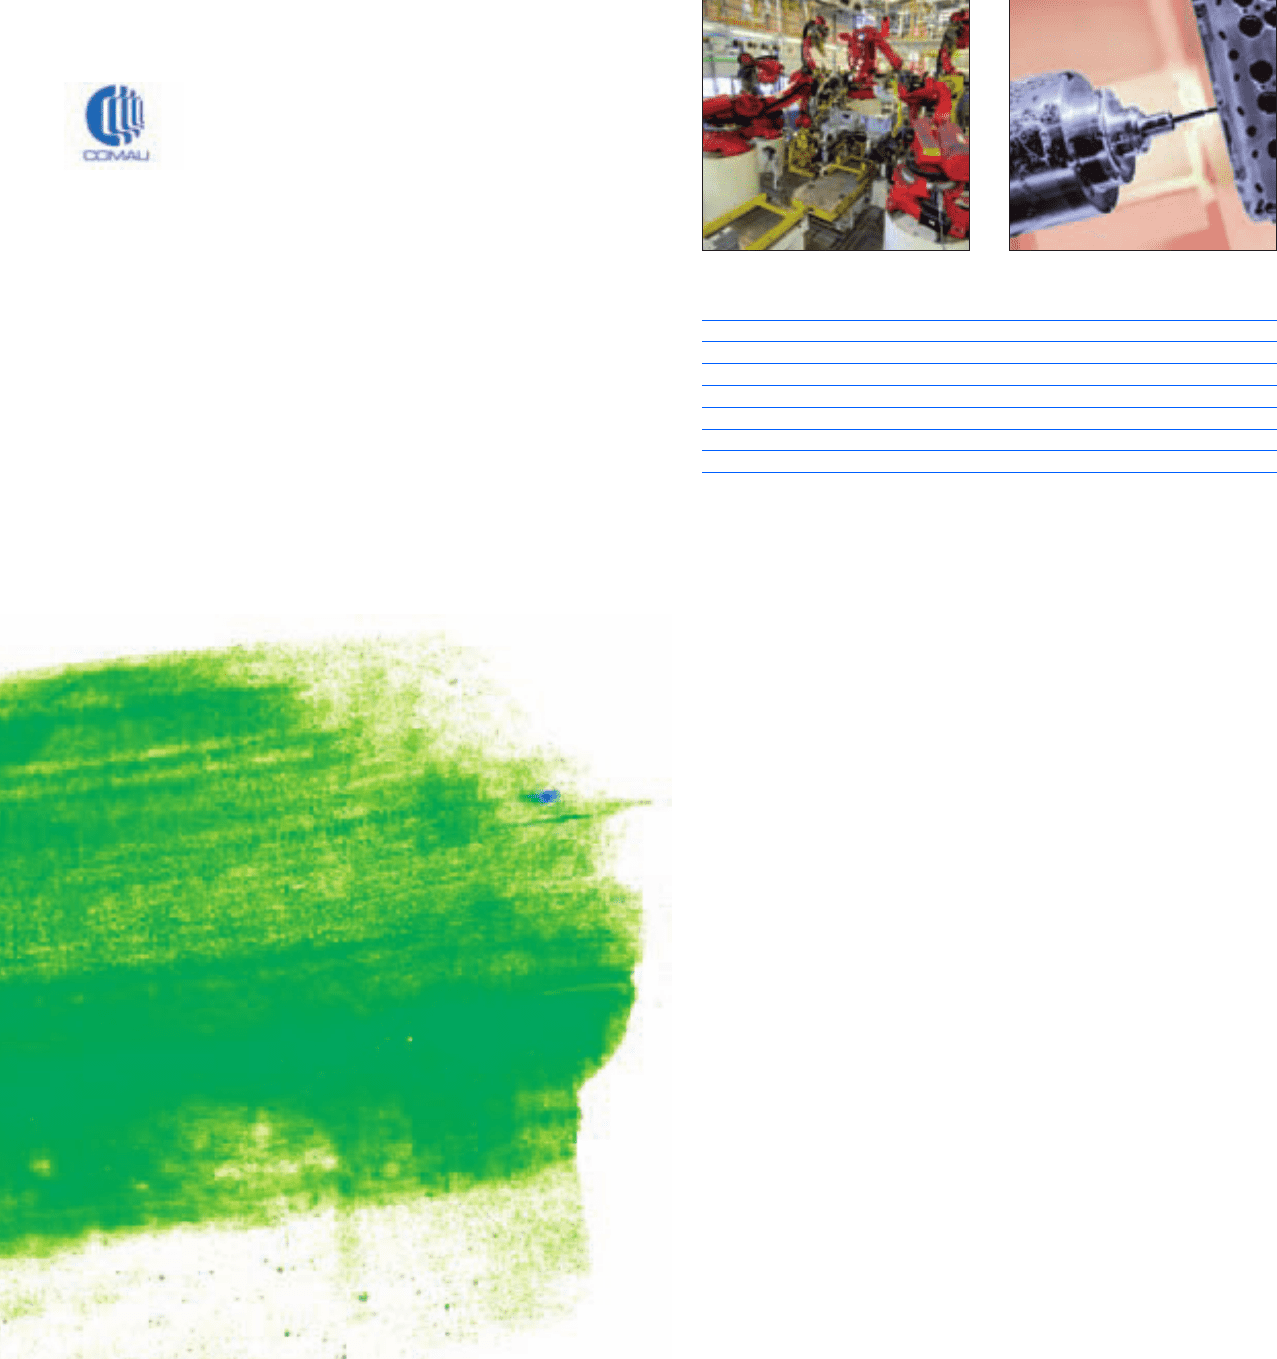
Production Systems — Comau
Operating Performance
In 2007, the Sector’s reference market continued to be impacted
by uncertainty, shrinking volumes and intense pressure on
prices.
Car manufacturers in western countries generally scaled back
their investment programmes, though they did not stop
introducing new models on the market. In fact, they continued
to focus on converting existing facilities and rationalizing
production capacity to the disadvantage of greenfield
investments.
By contrast, investments in a number of countries in Asia and
Eastern Europe increased often thanks to joint ventures
between western car manufacturers and local partners.
Highlights
(in millions of euros) 2007 2006
Net revenues 1,089 1,280
Trading profit (23) (66)
Operating result (*) (33) (272)
Investments in tangible and intangible assets (**) 33 56
- of which capitalised R&D costs 47
Total R&D expenses (***) 12 20
Employees at year-end (number) 11,960 12,293
(*) Including restructuring costs and unusual income (expenses).
(**) The 2007 figure includes 14 million euros for investments by Comau Inc. (U.S.A.) related to
sales/leaseback transactions carried out in previous years (in 2006 it included 34 million
euros).
(***) Including R&D capitalised and charged to operations.