Chrysler 2007 Annual Report Download - page 34
Download and view the complete annual report
Please find page 34 of the 2007 Chrysler annual report below. You can navigate through the pages in the report by either clicking on the pages listed below, or by using the keyword search tool below to find specific information within the annual report.-
 1
1 -
2
-
3
-
4
-
5
-
6
-
7
-
8
-
9
-
10
-
11
-
12
-
13
-
14
-
15
-
16
-
17
-
18
-
19
-
20
-
21
-
22
-
23
-
 24
24 -
 25
25 -
 26
26 -
 27
27 -
 28
28 -
 29
29 -
 30
30 -
 31
31 -
 32
32 -
 33
33 -
 34
34 -
 35
35 -
 36
36 -
 37
37 -
 38
38 -
 39
39 -
 40
40 -
 41
41 -
 42
42 -
 43
43 -
 44
44 -
45
-
46
-
47
-
48
-
49
-
50
-
51
-
52
-
53
-
54
-
55
-
56
-
57
-
58
-
59
-
60
-
61
-
62
-
63
-
64
-
65
-
66
-
67
-
68
-
69
-
70
-
71
-
72
-
73
-
74
-
75
-
76
-
77
-
78
-
79
-
80
-
81
-
82
-
83
-
84
-
85
-
86
-
87
-
88
-
89
-
90
-
91
-
92
-
93
-
94
-
95
-
96
-
97
-
98
-
99
-
100
-
101
-
102
-
103
-
104
-
105
-
106
-
107
-
108
-
109
-
110
-
111
-
112
-
113
-
114
-
115
-
116
-
117
-
118
-
119
-
120
-
121
-
122
-
123
-
124
-
125
-
126
-
127
-
128
-
129
-
130
-
131
-
132
-
133
-
134
-
135
-
136
-
137
-
138
-
139
-
140
-
141
-
142
-
143
-
144
-
145
-
146
-
147
-
148
-
149
-
150
-
151
-
152
-
153
-
154
-
155
-
156
-
157
-
158
-
159
-
160
-
161
-
162
-
163
-
164
-
165
-
166
-
167
-
168
-
169
-
170
-
171
-
172
-
173
-
174
-
175
-
176
-
177
-
178
-
179
-
180
-
181
-
182
-
183
-
184
-
185
-
186
-
187
-
188
-
189
-
190
-
191
-
192
-
193
-
194
-
195
-
196
-
197
-
198
-
199
-
200
-
201
-
202
-
203
-
204
-
205
-
206
-
207
-
208
-
209
-
210
-
211
-
212
-
213
-
214
-
215
-
216
-
217
-
218
-
219
-
220
-
221
-
222
-
223
-
224
-
225
-
226
-
227
-
228
-
229
-
230
-
231
-
232
-
233
-
234
-
235
-
236
-
237
-
238
-
239
-
240
-
241
-
242
-
243
-
244
-
245
-
246
-
247
-
248
-
249
-
250
-
251
-
252
-
253
-
254
-
255
-
256
-
257
-
258
-
259
-
260
-
261
-
262
-
263
-
264
-
265
-
266
-
267
-
268
-
269
-
270
-
271
-
272
-
273
-
274
-
275
-
276
-
277
-
278
-
279
-
280
-
281
-
282
-
283
-
284
-
285
-
286
-
287
-
288
-
289
-
290
-
291
-
292
-
293
-
294
-
295
-
296
-
297
-
298
-
299
-
300
-
301
-
302
-
303
-
304
-
305
-
306
-
307
-
308
-
309
-
310
-
311
-
312
-
313
-
314
-
315
-
316
-
317
-
318
-
319
-
320
-
321
-
322
-
323
-
324
-
325
-
326
-
327
-
328
-
329
-
330
-
331
-
332
-
333
-
334
-
335
-
336
-
337
-
338
-
339
-
340
-
341
 |
 |
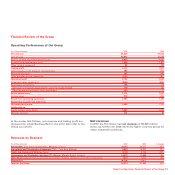
Report on Operations Financial Review of the Group 33
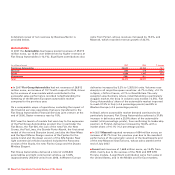
Agricultural and Construction Equipment
CNH - Case New Holland had revenues of 11,843 million euros.
The 12.5% increase from 2006 was negatively impacted by the
euro/dollar exchange rate; in US dollar terms, revenues
increased by 22.8%, as a result of higher volumes, improved
mix and prices, as well as new products.
In 2007 the global market for agricultural equipment grew by
2% over 2006. In North America demand for tractors and
combine harvesters rose by 2%. Increases in both product lines
were also recorded in Western Europe and in Latin America,
where demand for tractors and combine harvesters rose
sharply. In the Rest of the World markets, demand for tractors
decreased, against a very positive performance for combines.
All CNH brands gained market share, with particularly
significant improvements in combines and high horsepower
tractors.
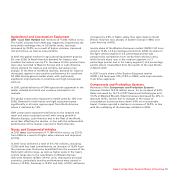
In 2007, global deliveries of CNH agricultural equipment to the
dealer network and retail unit volumes increased in all
markets.
The global construction equipment market grew by 13% over
2006. Demand for both heavy and light equipment grew
significantly in all main regions apart from North America,
where it declined by 12%.
CNH construction equipment deliveries to the network and
retail unit sales increased overall, with strong growth in
Western Europe, Latin America and in the Rest of the World,
more than offsetting the decline, in line with the unfavourable
performance of the market, reported in North America.
Trucks and Commercial Vehicles
In 2007 Iveco had revenues of 11,196 million euros, up 22.5%
from 2006 as a result of higher sales volumes and improved
pricing.
In 2007 Iveco delivered a total of 211,700 vehicles, including
13,300 with buy back commitments, an increase of 16.6% from
the previous year. Deliveries benefitted from the success of the
Daily light vehicle range, as well as higher sales in the heavy
vehicle range due to the new Stralis. In Western Europe
deliveries totalled 147,500 (+9.1%) units. Among the principal
countries, particularly positive performances were posted in
France (+12.9%), Germany (+12.4%) and Italy (+7.9%); deliveries
increased by 2.9% in Spain, while they were down in Great
Britain. Volumes rose sharply in Eastern Europe (+58%) and
Latin America (+45%).
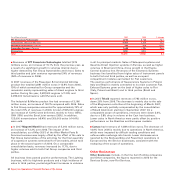
Iveco’s share of the Western European market (GVW >_ 2.8 tons)
stood at 10.3% (-0.3 percentage points from 2006). Its share in
the light vehicle segment (-0.4 percentage points) was
penalised by competition from car-derived vehicles (vans),
while Iveco’s share rose in the medium segment (+0.7
percentage points) and in the heavy segment (+0.5 percentage
points) where it benefitted from the launch of the new Stralis
in March 2007.
In 2007 Iveco’s share of the Eastern European market
(GVW >_ 2.8 tons) was 13% (11.8% in 2006), with improvements
in all three segments.
Components and Production Systems
Revenues of the Components and Production Systems
business totalled 13,375 million euros, for an increase of 8.2%.
Sales increased by 15.1% at FPT Powertrain Technologies and
12.2% at Magneti Marelli. Teksid revenues decreased by 20% in
absolute terms, mainly due to changes in the scope of
consolidation (revenues were down 3.4% on a comparable
basis). Comau reported a decline in revenues of 14.9%, in line
with the reshaping of the business initiated in 2006.