Chrysler 2007 Annual Report Download - page 144
Download and view the complete annual report
Please find page 144 of the 2007 Chrysler annual report below. You can navigate through the pages in the report by either clicking on the pages listed below, or by using the keyword search tool below to find specific information within the annual report.-
 1
1 -
2
-
3
-
4
-
5
-
6
-
7
-
8
-
9
-
10
-
11
-
12
-
13
-
14
-
15
-
16
-
17
-
18
-
19
-
20
-
21
-
22
-
23
-
24
-
25
-
26
-
27
-
28
-
29
-
30
-
31
-
32
-
33
-
34
-
35
-
36
-
37
-
38
-
39
-
40
-
41
-
42
-
43
-
44
-
45
-
46
-
47
-
48
-
49
-
50
-
51
-
52
-
53
-
54
-
55
-
56
-
57
-
58
-
59
-
60
-
61
-
62
-
63
-
64
-
65
-
66
-
67
-
68
-
69
-
70
-
71
-
72
-
73
-
74
-
75
-
76
-
77
-
78
-
79
-
80
-
81
-
82
-
83
-
84
-
85
-
86
-
87
-
88
-
89
-
90
-
91
-
92
-
93
-
94
-
95
-
96
-
97
-
98
-
99
-
100
-
101
-
102
-
103
-
104
-
105
-
106
-
107
-
108
-
109
-
110
-
111
-
112
-
113
-
114
-
115
-
116
-
117
-
118
-
119
-
120
-
121
-
122
-
123
-
124
-
125
-
126
-
127
-
128
-
129
-
130
-
131
-
132
-
133
-
 134
134 -
 135
135 -
 136
136 -
 137
137 -
 138
138 -
 139
139 -
 140
140 -
 141
141 -
 142
142 -
 143
143 -
 144
144 -
 145
145 -
 146
146 -
 147
147 -
 148
148 -
 149
149 -
 150
150 -
 151
151 -
 152
152 -
 153
153 -
 154
154 -
155
-
156
-
157
-
158
-
159
-
160
-
161
-
162
-
163
-
164
-
165
-
166
-
167
-
168
-
169
-
170
-
171
-
172
-
173
-
174
-
175
-
176
-
177
-
178
-
179
-
180
-
181
-
182
-
183
-
184
-
185
-
186
-
187
-
188
-
189
-
190
-
191
-
192
-
193
-
194
-
195
-
196
-
197
-
198
-
199
-
200
-
201
-
202
-
203
-
204
-
205
-
206
-
207
-
208
-
209
-
210
-
211
-
212
-
213
-
214
-
215
-
216
-
217
-
218
-
219
-
220
-
221
-
222
-
223
-
224
-
225
-
226
-
227
-
228
-
229
-
230
-
231
-
232
-
233
-
234
-
235
-
236
-
237
-
238
-
239
-
240
-
241
-
242
-
243
-
244
-
245
-
246
-
247
-
248
-
249
-
250
-
251
-
252
-
253
-
254
-
255
-
256
-
257
-
258
-
259
-
260
-
261
-
262
-
263
-
264
-
265
-
266
-
267
-
268
-
269
-
270
-
271
-
272
-
273
-
274
-
275
-
276
-
277
-
278
-
279
-
280
-
281
-
282
-
283
-
284
-
285
-
286
-
287
-
288
-
289
-
290
-
291
-
292
-
293
-
294
-
295
-
296
-
297
-
298
-
299
-
300
-
301
-
302
-
303
-
304
-
305
-
306
-
307
-
308
-
309
-
310
-
311
-
312
-
313
-
314
-
315
-
316
-
317
-
318
-
319
-
320
-
321
-
322
-
323
-
324
-
325
-
326
-
327
-
328
-
329
-
330
-
331
-
332
-
333
-
334
-
335
-
336
-
337
-
338
-
339
-
340
-
341
 |
 |

143Fiat Group Consolidated Financial Statements at December 31, 2007 - Notes
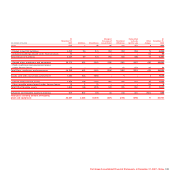
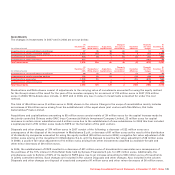
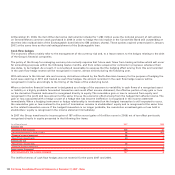
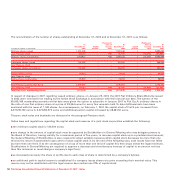
19. Current receivables
The composition of the caption and the analysis by due date is as follows:
At December 31, 2007 At December 31, 2006
Due between Due between
Due within one and Due beyond Due within one and Due beyond
(in millions of euros) one year five years five years Total one year five years five years Total
Trade receivables 4,323 51 10 4,384 4,843 70 31 4,944
Receivables from financing activities 6,542 5,565 161 12,268 7,065 4,469 209 11,743
Other receivables 2,470 505 228 3,203 2,303 397 139 2,839
Total Current receivables 13,335 6,121 399 19,855 14,211 4,936 379 19,526
At December 31, 2007, Current receivables include receivables sold and financed through both securitisation and factoring
transactions of 6,290 millions of euros (7,717 millions of euros at December 31, 2006) which do not meet IAS 39 derecognition
requirements. These receivables are recognised as such in the Group financial statements even though they have been legally sold;
a corresponding financial liability is recorded in the consolidated balance sheet as Asset-backed financing (see Note 28).
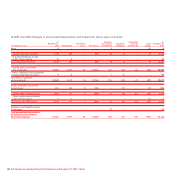
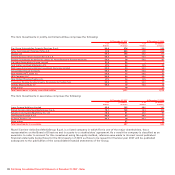
Trade receivables
Trade receivables are shown net of allowances for doubtful accounts of 469 million euros at December 31, 2007 (514 million euros
at December 31, 2006), determined on the basis of historical losses on receivables. Changes in the allowance accounts during the
year are as follows:
At Change in At
December 31, Use and the scope of December 31,
(in millions of euros) 2006 Provision other changes consolidation 2007
Allowances for doubtful accounts 514 89 (145) 11 469
The carrying amount of Trade receivables is considered in line with their fair value at the date.
At December 31, 2007, trade receivables of 45 million euros were pledged as security for loans obtained (42 million euros at
December 31, 2006).
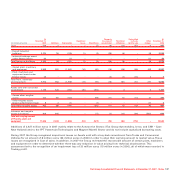
Receivables from financing activities
Receivables from financing activities include the following:
(in millions of euros) At December 31, 2007 At December 31, 2006
Retail financing 6,601 6,482
Finance leases 690 580
Dealer financing 4,477 4,084
Supplier financing 104 234
Current financial receivables from jointly controlled financial services entities 81 143
Financial receivables from companies under joint control, associates and unconsolidated subsidiaries 152 22
Other 163 198
Total Receivables from financing activities 12,268 11,743