Chrysler 2007 Annual Report Download - page 11
Download and view the complete annual report
Please find page 11 of the 2007 Chrysler annual report below. You can navigate through the pages in the report by either clicking on the pages listed below, or by using the keyword search tool below to find specific information within the annual report.-
 1
1 -
 2
2 -
 3
3 -
 4
4 -
 5
5 -
 6
6 -
 7
7 -
 8
8 -
 9
9 -
 10
10 -
 11
11 -
 12
12 -
 13
13 -
 14
14 -
 15
15 -
 16
16 -
 17
17 -
 18
18 -
 19
19 -
 20
20 -
 21
21 -
 22
22 -
23
-
24
-
25
-
26
-
27
-
28
-
29
-
30
-
31
-
32
-
33
-
34
-
35
-
36
-
37
-
38
-
39
-
40
-
41
-
42
-
43
-
44
-
45
-
46
-
47
-
48
-
49
-
50
-
51
-
52
-
53
-
54
-
55
-
56
-
57
-
58
-
59
-
60
-
61
-
62
-
63
-
64
-
65
-
66
-
67
-
68
-
69
-
70
-
71
-
72
-
73
-
74
-
75
-
76
-
77
-
78
-
79
-
80
-
81
-
82
-
83
-
84
-
85
-
86
-
87
-
88
-
89
-
90
-
91
-
92
-
93
-
94
-
95
-
96
-
97
-
98
-
99
-
100
-
101
-
102
-
103
-
104
-
105
-
106
-
107
-
108
-
109
-
110
-
111
-
112
-
113
-
114
-
115
-
116
-
117
-
118
-
119
-
120
-
121
-
122
-
123
-
124
-
125
-
126
-
127
-
128
-
129
-
130
-
131
-
132
-
133
-
134
-
135
-
136
-
137
-
138
-
139
-
140
-
141
-
142
-
143
-
144
-
145
-
146
-
147
-
148
-
149
-
150
-
151
-
152
-
153
-
154
-
155
-
156
-
157
-
158
-
159
-
160
-
161
-
162
-
163
-
164
-
165
-
166
-
167
-
168
-
169
-
170
-
171
-
172
-
173
-
174
-
175
-
176
-
177
-
178
-
179
-
180
-
181
-
182
-
183
-
184
-
185
-
186
-
187
-
188
-
189
-
190
-
191
-
192
-
193
-
194
-
195
-
196
-
197
-
198
-
199
-
200
-
201
-
202
-
203
-
204
-
205
-
206
-
207
-
208
-
209
-
210
-
211
-
212
-
213
-
214
-
215
-
216
-
217
-
218
-
219
-
220
-
221
-
222
-
223
-
224
-
225
-
226
-
227
-
228
-
229
-
230
-
231
-
232
-
233
-
234
-
235
-
236
-
237
-
238
-
239
-
240
-
241
-
242
-
243
-
244
-
245
-
246
-
247
-
248
-
249
-
250
-
251
-
252
-
253
-
254
-
255
-
256
-
257
-
258
-
259
-
260
-
261
-
262
-
263
-
264
-
265
-
266
-
267
-
268
-
269
-
270
-
271
-
272
-
273
-
274
-
275
-
276
-
277
-
278
-
279
-
280
-
281
-
282
-
283
-
284
-
285
-
286
-
287
-
288
-
289
-
290
-
291
-
292
-
293
-
294
-
295
-
296
-
297
-
298
-
299
-
300
-
301
-
302
-
303
-
304
-
305
-
306
-
307
-
308
-
309
-
310
-
311
-
312
-
313
-
314
-
315
-
316
-
317
-
318
-
319
-
320
-
321
-
322
-
323
-
324
-
325
-
326
-
327
-
328
-
329
-
330
-
331
-
332
-
333
-
334
-
335
-
336
-
337
-
338
-
339
-
340
-
341
 |
 |
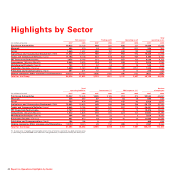
2007 at a glance
Report on Operations 2007 at a glance10
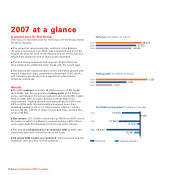
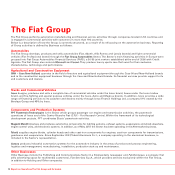
A pivotal year for Fiat Group
2007 was an important year for the future of Fiat Group mainly
for three reasons:
■The industrial turnaround plan, outlined in the Balocco
investor’s meeting in July 2004, was completed and all of the
targets set then for each of the Sectors and for the Group as a
whole were achieved, and in many cases exceeded.
■The Fiat Group Industrial Activities are finally debt free,
thus marking an additional clean break with the recent past.
■Fiat started the implementation of the 2007-2010 growth and
margin expansion plan, presented in November 2006, which
will transform the Group into a significant international
industrial enterprise.
Results
■On 2007 revenues of nearly 59 billion euros (12.9% higher
than 2006), Fiat Group posted a trading profit of 3.2 billion
euros, well ahead of previous guidance and nearly 66% higher
than in 2006, with all major Sectors contributing to the
improvement. Trading margin rose accordingly to 5.5% from
3.8% in 2006, with the Automobiles business more than
doubling trading profit to 1.1 billion euros, CNH at 1 billion
euros (+34.3%; +46.7% in dollar terms) and Iveco at 0.8 billion
euros (+48.9%).
■Net income of 2.1 billion euros was up 78.5% on 2006, and is
the basis on which the Board is recommending a 523 million
euros aggregate dividend payout across all share classes.
■Fiat Group extinguished its net industrial debt in 2007, and
closed the year with 0.4 billion euros net cash.
■All Group 2008 targets are confirmed, with revenues and net
industrial cash position revised upwards.
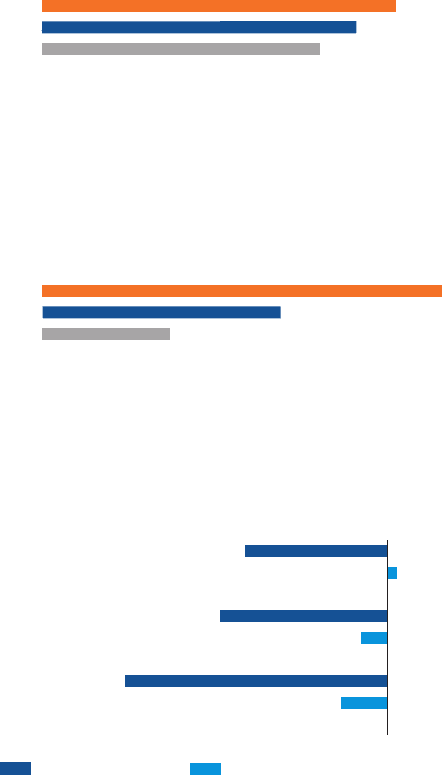
2007
2006
2005
3,233
1,951
Trading profit (in millions of euros)
1,000
2007
2006
2005
355
Net (Debt)/cash position (in millions of euros)
(3,219)
(10,423)
(11,836)
(1,773)
(18,523)
Fiat Group Industrial Activities
0
2007
2006
2005
58,529
51,832
Revenues (in millions of euros)
46,544