Chrysler 2007 Annual Report Download - page 105
Download and view the complete annual report
Please find page 105 of the 2007 Chrysler annual report below. You can navigate through the pages in the report by either clicking on the pages listed below, or by using the keyword search tool below to find specific information within the annual report.-
 1
1 -
2
-
3
-
4
-
5
-
6
-
7
-
8
-
9
-
10
-
11
-
12
-
13
-
14
-
15
-
16
-
17
-
18
-
19
-
20
-
21
-
22
-
23
-
24
-
25
-
26
-
27
-
28
-
29
-
30
-
31
-
32
-
33
-
34
-
35
-
36
-
37
-
38
-
39
-
40
-
41
-
42
-
43
-
44
-
45
-
46
-
47
-
48
-
49
-
50
-
51
-
52
-
53
-
54
-
55
-
56
-
57
-
58
-
59
-
60
-
61
-
62
-
63
-
64
-
65
-
66
-
67
-
68
-
69
-
70
-
71
-
72
-
73
-
74
-
75
-
76
-
77
-
78
-
79
-
80
-
81
-
82
-
83
-
84
-
85
-
86
-
87
-
88
-
89
-
90
-
91
-
92
-
93
-
94
-
 95
95 -
 96
96 -
 97
97 -
 98
98 -
 99
99 -
 100
100 -
 101
101 -
 102
102 -
 103
103 -
 104
104 -
 105
105 -
 106
106 -
 107
107 -
 108
108 -
 109
109 -
 110
110 -
 111
111 -
 112
112 -
 113
113 -
 114
114 -
 115
115 -
116
-
117
-
118
-
119
-
120
-
121
-
122
-
123
-
124
-
125
-
126
-
127
-
128
-
129
-
130
-
131
-
132
-
133
-
134
-
135
-
136
-
137
-
138
-
139
-
140
-
141
-
142
-
143
-
144
-
145
-
146
-
147
-
148
-
149
-
150
-
151
-
152
-
153
-
154
-
155
-
156
-
157
-
158
-
159
-
160
-
161
-
162
-
163
-
164
-
165
-
166
-
167
-
168
-
169
-
170
-
171
-
172
-
173
-
174
-
175
-
176
-
177
-
178
-
179
-
180
-
181
-
182
-
183
-
184
-
185
-
186
-
187
-
188
-
189
-
190
-
191
-
192
-
193
-
194
-
195
-
196
-
197
-
198
-
199
-
200
-
201
-
202
-
203
-
204
-
205
-
206
-
207
-
208
-
209
-
210
-
211
-
212
-
213
-
214
-
215
-
216
-
217
-
218
-
219
-
220
-
221
-
222
-
223
-
224
-
225
-
226
-
227
-
228
-
229
-
230
-
231
-
232
-
233
-
234
-
235
-
236
-
237
-
238
-
239
-
240
-
241
-
242
-
243
-
244
-
245
-
246
-
247
-
248
-
249
-
250
-
251
-
252
-
253
-
254
-
255
-
256
-
257
-
258
-
259
-
260
-
261
-
262
-
263
-
264
-
265
-
266
-
267
-
268
-
269
-
270
-
271
-
272
-
273
-
274
-
275
-
276
-
277
-
278
-
279
-
280
-
281
-
282
-
283
-
284
-
285
-
286
-
287
-
288
-
289
-
290
-
291
-
292
-
293
-
294
-
295
-
296
-
297
-
298
-
299
-
300
-
301
-
302
-
303
-
304
-
305
-
306
-
307
-
308
-
309
-
310
-
311
-
312
-
313
-
314
-
315
-
316
-
317
-
318
-
319
-
320
-
321
-
322
-
323
-
324
-
325
-
326
-
327
-
328
-
329
-
330
-
331
-
332
-
333
-
334
-
335
-
336
-
337
-
338
-
339
-
340
-
341
 |
 |
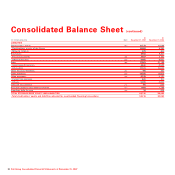
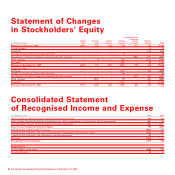
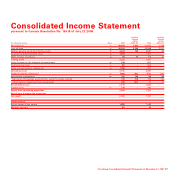
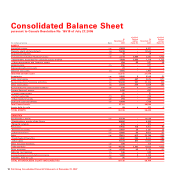
Fiat Group Consolidated Financial Statements at December 31, 2007 - Notes104
development costs) and tangible assets, in order to determine
whether there is any indication that those assets have suffered
an impairment loss. If indications of impairment are present,
the carrying amount of the asset is reduced to its recoverable
amount. An intangible asset with an indefinite useful life is
tested for impairment annually or more frequently, whenever
there is an indication that the asset may be impaired.
Where it is not possible to estimate the recoverable amount of
an individual asset, the Group estimates the recoverable
amount of the cash-generating unit to which the asset belongs.
The recoverable amount of an asset is the higher of fair value
less disposal costs and its value in use. In assessing its value
in use, the pre-tax estimated future cash flows are discounted
to their present value using a pre-tax discount rate that
reflects current market assessments of the time value of
money and the risks specific to the asset. An impairment loss
is recognised when the recoverable amount is lower than the
carrying amount. Where an impairment loss on assets other
than goodwill subsequently no longer exists or has decreased
the carrying amount of the asset or cash-generating unit is
increased to the revised estimate of its recoverable amount,
but not in excess of the carrying amount that would have been
recorded had no impairment loss been recognised. A reversal
of an impairment loss is recognised in the income statement
immediately.
Financial instruments
Presentation
Financial instruments held by the Group are presented in the
financial statements as described in the following paragraphs.
Investments and other non-current financial assets comprise
investments in non-consolidated companies and other non-
current financial assets (held-to-maturity securities, non-
current loans and receivables and other non-current available-
for-sale financial assets).
Current financial assets include trade receivables, receivables
from financing activities (retail financing, dealer financing,
lease financing and other current loans to third parties), current
securities, and other current financial assets (which include
derivative financial instruments stated at fair value as assets),
as well as cash and cash equivalents.
In particular, Cash and cash equivalents include cash at banks,
units in liquidity funds and other money market securities that
are readily convertible into cash and are subject to an
insignificant risk of changes in value.
Current securities include short-term or marketable securities
which represent temporary investments of available funds and
do not satisfy the requirements for being classified as cash
equivalents; current securities include both available-for-sale
and held for trading securities.
Financial liabilities refer to debt, which includes asset-backed
financing, and other financial liabilities (which include
derivative financial instruments stated at fair value as
liabilities), trade payables and other payables.
Measurement
Investments in unconsolidated companies classified as non-
current financial assets are accounted for as described in the
section Basis of consolidation.
Non-current financial assets other than investments, as well as
current financial assets and financial liabilities, are accounted
for in accordance with IAS 39 –
Financial Instruments:
Recognition and Measurement
.
Current financial assets and held-to-maturity securities are
recognised on the basis of the settlement date and, on initial
recognition, are measured at acquisition cost, including
transaction costs.
Subsequent to initial recognition, available-for-sale and held
for trading financial assets are measured at fair value. When
market prices are not available, the fair value of available-for-
sale financial assets is measured using appropriate valuation
techniques e.g. discounted cash flow analysis based on market
information available at the balance sheet date.
Gains and losses on available-for-sale financial assets are
recognised directly in equity until the financial asset is