Chrysler 2007 Annual Report Download - page 104
Download and view the complete annual report
Please find page 104 of the 2007 Chrysler annual report below. You can navigate through the pages in the report by either clicking on the pages listed below, or by using the keyword search tool below to find specific information within the annual report.-
 1
1 -
2
-
3
-
4
-
5
-
6
-
7
-
8
-
9
-
10
-
11
-
12
-
13
-
14
-
15
-
16
-
17
-
18
-
19
-
20
-
21
-
22
-
23
-
24
-
25
-
26
-
27
-
28
-
29
-
30
-
31
-
32
-
33
-
34
-
35
-
36
-
37
-
38
-
39
-
40
-
41
-
42
-
43
-
44
-
45
-
46
-
47
-
48
-
49
-
50
-
51
-
52
-
53
-
54
-
55
-
56
-
57
-
58
-
59
-
60
-
61
-
62
-
63
-
64
-
65
-
66
-
67
-
68
-
69
-
70
-
71
-
72
-
73
-
74
-
75
-
76
-
77
-
78
-
79
-
80
-
81
-
82
-
83
-
84
-
85
-
86
-
87
-
88
-
89
-
90
-
91
-
92
-
93
-
 94
94 -
 95
95 -
 96
96 -
 97
97 -
 98
98 -
 99
99 -
 100
100 -
 101
101 -
 102
102 -
 103
103 -
 104
104 -
 105
105 -
 106
106 -
 107
107 -
 108
108 -
 109
109 -
 110
110 -
 111
111 -
 112
112 -
 113
113 -
 114
114 -
115
-
116
-
117
-
118
-
119
-
120
-
121
-
122
-
123
-
124
-
125
-
126
-
127
-
128
-
129
-
130
-
131
-
132
-
133
-
134
-
135
-
136
-
137
-
138
-
139
-
140
-
141
-
142
-
143
-
144
-
145
-
146
-
147
-
148
-
149
-
150
-
151
-
152
-
153
-
154
-
155
-
156
-
157
-
158
-
159
-
160
-
161
-
162
-
163
-
164
-
165
-
166
-
167
-
168
-
169
-
170
-
171
-
172
-
173
-
174
-
175
-
176
-
177
-
178
-
179
-
180
-
181
-
182
-
183
-
184
-
185
-
186
-
187
-
188
-
189
-
190
-
191
-
192
-
193
-
194
-
195
-
196
-
197
-
198
-
199
-
200
-
201
-
202
-
203
-
204
-
205
-
206
-
207
-
208
-
209
-
210
-
211
-
212
-
213
-
214
-
215
-
216
-
217
-
218
-
219
-
220
-
221
-
222
-
223
-
224
-
225
-
226
-
227
-
228
-
229
-
230
-
231
-
232
-
233
-
234
-
235
-
236
-
237
-
238
-
239
-
240
-
241
-
242
-
243
-
244
-
245
-
246
-
247
-
248
-
249
-
250
-
251
-
252
-
253
-
254
-
255
-
256
-
257
-
258
-
259
-
260
-
261
-
262
-
263
-
264
-
265
-
266
-
267
-
268
-
269
-
270
-
271
-
272
-
273
-
274
-
275
-
276
-
277
-
278
-
279
-
280
-
281
-
282
-
283
-
284
-
285
-
286
-
287
-
288
-
289
-
290
-
291
-
292
-
293
-
294
-
295
-
296
-
297
-
298
-
299
-
300
-
301
-
302
-
303
-
304
-
305
-
306
-
307
-
308
-
309
-
310
-
311
-
312
-
313
-
314
-
315
-
316
-
317
-
318
-
319
-
320
-
321
-
322
-
323
-
324
-
325
-
326
-
327
-
328
-
329
-
330
-
331
-
332
-
333
-
334
-
335
-
336
-
337
-
338
-
339
-
340
-
341
 |
 |

Fiat Group Consolidated Financial Statements at December 31, 2007 - Notes 103
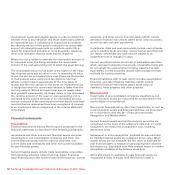
All other development costs are expensed as incurred.
Intangible assets with indefinite useful lives
Intangible assets with indefinite useful lives consist principally of
acquired trademarks which have no legal, contractual, competitive,
economic, or other factors that limit their useful lives. Intangible
assets with indefinite useful lives are not amortised, but are tested
for impairment annually or more frequently whenever there is an
indication that the asset may be impaired.
Other intangible assets
Other purchased and internally-generated intangible assets are
recognised as assets in accordance with IAS 38 –
Intangible
Assets
, where it is probable that the use of the asset will
generate future economic benefits and where the costs of the
asset can be determined reliably.
Such assets are measured at purchase or manufacturing cost
and amortised on a straight-line basis over their estimated
useful lives, if these assets have finite useful lives.
Other intangible assets acquired as part of an acquisition of a
business are capitalised separately from goodwill if their fair
value can be measured reliably.
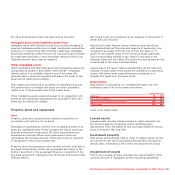
Property, plant and equipment
Cost
Property, plant and equipment are stated at acquisition or
production cost and are not revalued.
Subsequent expenditures and the cost of replacing parts of an
asset are capitalised only if they increase the future economic
benefits embodied in that asset. All other expenditures are
expensed as incurred. When such replacement costs are
capitalised, the carrying amount of the parts that are replaced
is recognised in the income statement.
Property, plant and equipment also include vehicles sold with a
buy-back commitment, which are recognised according to the
method described in the paragraph Revenue recognition if the
buy-back agreement originates from the Trucks and Commercial
Vehicles Sector.
Borrowing costs are recognised as an expense in the period in
which they are incurred.
Assets held under finance leases, which provide the Group
with substantially all the risks and rewards of ownership, are
recognised as assets of the Group at their fair value or, if
lower, at the present value of the minimum lease payments.
The corresponding liability to the lessor is included in the
financial statement as a debt. The assets are depreciated by the
method and at the rates indicated below.
Leases where the lessor retains substantially all the risks and
rewards of ownership of the assets are classified as operating
leases. Operating lease expenditures are expensed on a
straight-line basis over the lease terms.
Depreciation
Depreciation is calculated on a straight-line basis over the
estimated useful life of the assets as follows:
Depreciation rates
Buildings 2% - 10%
Plant and machinery 8% - 30%
Industrial and commercial equipment 15% - 25%
Other assets 10% - 33%
Land is not depreciated.
Leased assets
Leased assets include vehicles leased to retail customers by
the Group's leasing companies under operating lease
agreements. They are stated at cost and depreciated at annual
rates of between 15% and 25%.
Investment property
Real estate and buildings held in order to obtain rental income
are carried at cost less accumulated depreciation (charged at
annual rates of between 2.5% to 5%) and impairment losses.
Impairment of assets
The Group reviews, at least annually, the recoverability of the
carrying amount of intangible assets (including capitalised