Chrysler 2007 Annual Report Download - page 128
Download and view the complete annual report
Please find page 128 of the 2007 Chrysler annual report below. You can navigate through the pages in the report by either clicking on the pages listed below, or by using the keyword search tool below to find specific information within the annual report.-
 1
1 -
2
-
3
-
4
-
5
-
6
-
7
-
8
-
9
-
10
-
11
-
12
-
13
-
14
-
15
-
16
-
17
-
18
-
19
-
20
-
21
-
22
-
23
-
24
-
25
-
26
-
27
-
28
-
29
-
30
-
31
-
32
-
33
-
34
-
35
-
36
-
37
-
38
-
39
-
40
-
41
-
42
-
43
-
44
-
45
-
46
-
47
-
48
-
49
-
50
-
51
-
52
-
53
-
54
-
55
-
56
-
57
-
58
-
59
-
60
-
61
-
62
-
63
-
64
-
65
-
66
-
67
-
68
-
69
-
70
-
71
-
72
-
73
-
74
-
75
-
76
-
77
-
78
-
79
-
80
-
81
-
82
-
83
-
84
-
85
-
86
-
87
-
88
-
89
-
90
-
91
-
92
-
93
-
94
-
95
-
96
-
97
-
98
-
99
-
100
-
101
-
102
-
103
-
104
-
105
-
106
-
107
-
108
-
109
-
110
-
111
-
112
-
113
-
114
-
115
-
116
-
117
-
 118
118 -
 119
119 -
 120
120 -
 121
121 -
 122
122 -
 123
123 -
 124
124 -
 125
125 -
 126
126 -
 127
127 -
 128
128 -
 129
129 -
 130
130 -
 131
131 -
 132
132 -
 133
133 -
 134
134 -
 135
135 -
 136
136 -
 137
137 -
 138
138 -
139
-
140
-
141
-
142
-
143
-
144
-
145
-
146
-
147
-
148
-
149
-
150
-
151
-
152
-
153
-
154
-
155
-
156
-
157
-
158
-
159
-
160
-
161
-
162
-
163
-
164
-
165
-
166
-
167
-
168
-
169
-
170
-
171
-
172
-
173
-
174
-
175
-
176
-
177
-
178
-
179
-
180
-
181
-
182
-
183
-
184
-
185
-
186
-
187
-
188
-
189
-
190
-
191
-
192
-
193
-
194
-
195
-
196
-
197
-
198
-
199
-
200
-
201
-
202
-
203
-
204
-
205
-
206
-
207
-
208
-
209
-
210
-
211
-
212
-
213
-
214
-
215
-
216
-
217
-
218
-
219
-
220
-
221
-
222
-
223
-
224
-
225
-
226
-
227
-
228
-
229
-
230
-
231
-
232
-
233
-
234
-
235
-
236
-
237
-
238
-
239
-
240
-
241
-
242
-
243
-
244
-
245
-
246
-
247
-
248
-
249
-
250
-
251
-
252
-
253
-
254
-
255
-
256
-
257
-
258
-
259
-
260
-
261
-
262
-
263
-
264
-
265
-
266
-
267
-
268
-
269
-
270
-
271
-
272
-
273
-
274
-
275
-
276
-
277
-
278
-
279
-
280
-
281
-
282
-
283
-
284
-
285
-
286
-
287
-
288
-
289
-
290
-
291
-
292
-
293
-
294
-
295
-
296
-
297
-
298
-
299
-
300
-
301
-
302
-
303
-
304
-
305
-
306
-
307
-
308
-
309
-
310
-
311
-
312
-
313
-
314
-
315
-
316
-
317
-
318
-
319
-
320
-
321
-
322
-
323
-
324
-
325
-
326
-
327
-
328
-
329
-
330
-
331
-
332
-
333
-
334
-
335
-
336
-
337
-
338
-
339
-
340
-
341
 |
 |

127Fiat Group Consolidated Financial Statements at December 31, 2007 - Notes
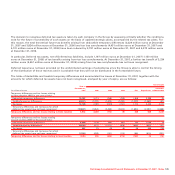
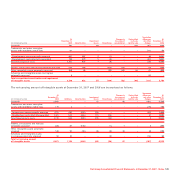
adjusted to take into account the dilutive effects that would arise if the stock options granted by the Group’s subsidiaries on their
equity instruments were to be exercised.
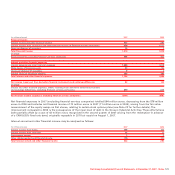
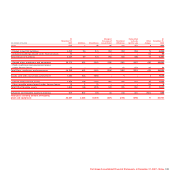
Figures used to determine diluted earnings per shares are as follows:
2007 2006
Ordinary Preference Saving Ordinary Preference Saving
shares shares shares Total shares shares shares Total
Profit attributable to each
class of shares millions of euros 1,660 158 134 1,952 859 81 125 1,065
Weighted average number
of shares outstanding thousand 1,079,175 103,292 79,913 1,262,380 1,088,027 103,292 79,913 1,271,232
Number of shares that would
be issued from stock option plans thousand 9,046 – – 9,046 1,580 – – 1,580
Number of shares considered
in the diluted earnings per share thousand 1,088,221 103,292 79,913 1,271,426 1,089,607 103,292 79,913 1,272,812
Diluted earnings per share euros 1.526 1.526 1.681 0.788 0.788 1.563
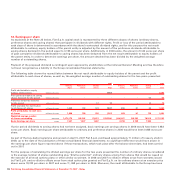
Balance Sheet
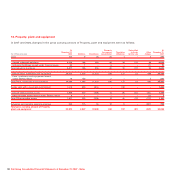
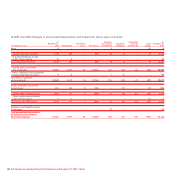
13. Intangible assets
In 2007 and 2006, changes in the gross carrying amount of Intangible assets were as follows:
Translation
At Changes in Reclassified differences At
December 31, the scope of to Assets and other December 31,
(in millions of euros) 2006 Additions Divestitures consolidation held for sale changes 2007
Goodwill 3,534 – (45) 69 – (229) 3,329
Trademarks and other intangible assets with indefinite useful lives 229 2 – – – (23) 208
- Development costs externally acquired 2,376 430 (1) – – (37) 2,768
- Development costs internally generated 2,452 502 (27) – – 37 2,964
Total Development costs 4,828 932 (28) – – – 5,732
Patents, concessions and licenses externally acquired 990 87 (37) 1 (1) 17 1,057
Other intangible assets externally acquired 552 97 (19) 37 – 91 758
Advances and intangible assets in progress externally acquired 52 20 (2) – – (16) 54
Total gross carrying amount of Intangible assets 10,185 1,138 (131) 107 (1) (160) 11,138