Chrysler 2007 Annual Report Download - page 51
Download and view the complete annual report
Please find page 51 of the 2007 Chrysler annual report below. You can navigate through the pages in the report by either clicking on the pages listed below, or by using the keyword search tool below to find specific information within the annual report.-
 1
1 -
2
-
3
-
4
-
5
-
6
-
7
-
8
-
9
-
10
-
11
-
12
-
13
-
14
-
15
-
16
-
17
-
18
-
19
-
20
-
21
-
22
-
23
-
24
-
25
-
26
-
27
-
28
-
29
-
30
-
31
-
32
-
33
-
34
-
35
-
36
-
37
-
38
-
39
-
40
-
 41
41 -
 42
42 -
 43
43 -
 44
44 -
 45
45 -
 46
46 -
 47
47 -
 48
48 -
 49
49 -
 50
50 -
 51
51 -
 52
52 -
 53
53 -
 54
54 -
 55
55 -
 56
56 -
 57
57 -
 58
58 -
 59
59 -
 60
60 -
 61
61 -
62
-
63
-
64
-
65
-
66
-
67
-
68
-
69
-
70
-
71
-
72
-
73
-
74
-
75
-
76
-
77
-
78
-
79
-
80
-
81
-
82
-
83
-
84
-
85
-
86
-
87
-
88
-
89
-
90
-
91
-
92
-
93
-
94
-
95
-
96
-
97
-
98
-
99
-
100
-
101
-
102
-
103
-
104
-
105
-
106
-
107
-
108
-
109
-
110
-
111
-
112
-
113
-
114
-
115
-
116
-
117
-
118
-
119
-
120
-
121
-
122
-
123
-
124
-
125
-
126
-
127
-
128
-
129
-
130
-
131
-
132
-
133
-
134
-
135
-
136
-
137
-
138
-
139
-
140
-
141
-
142
-
143
-
144
-
145
-
146
-
147
-
148
-
149
-
150
-
151
-
152
-
153
-
154
-
155
-
156
-
157
-
158
-
159
-
160
-
161
-
162
-
163
-
164
-
165
-
166
-
167
-
168
-
169
-
170
-
171
-
172
-
173
-
174
-
175
-
176
-
177
-
178
-
179
-
180
-
181
-
182
-
183
-
184
-
185
-
186
-
187
-
188
-
189
-
190
-
191
-
192
-
193
-
194
-
195
-
196
-
197
-
198
-
199
-
200
-
201
-
202
-
203
-
204
-
205
-
206
-
207
-
208
-
209
-
210
-
211
-
212
-
213
-
214
-
215
-
216
-
217
-
218
-
219
-
220
-
221
-
222
-
223
-
224
-
225
-
226
-
227
-
228
-
229
-
230
-
231
-
232
-
233
-
234
-
235
-
236
-
237
-
238
-
239
-
240
-
241
-
242
-
243
-
244
-
245
-
246
-
247
-
248
-
249
-
250
-
251
-
252
-
253
-
254
-
255
-
256
-
257
-
258
-
259
-
260
-
261
-
262
-
263
-
264
-
265
-
266
-
267
-
268
-
269
-
270
-
271
-
272
-
273
-
274
-
275
-
276
-
277
-
278
-
279
-
280
-
281
-
282
-
283
-
284
-
285
-
286
-
287
-
288
-
289
-
290
-
291
-
292
-
293
-
294
-
295
-
296
-
297
-
298
-
299
-
300
-
301
-
302
-
303
-
304
-
305
-
306
-
307
-
308
-
309
-
310
-
311
-
312
-
313
-
314
-
315
-
316
-
317
-
318
-
319
-
320
-
321
-
322
-
323
-
324
-
325
-
326
-
327
-
328
-
329
-
330
-
331
-
332
-
333
-
334
-
335
-
336
-
337
-
338
-
339
-
340
-
341
 |
 |

Report on Operations Financial Review of the Group50
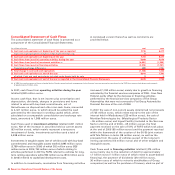
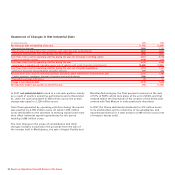
Statement of Changes in Net Industrial Debt
(in millions of euros) 2007 2006
Net industrial debt at beginning of the year (1,773) (3,219)
- Net result for the year 2,054 1,151
- Amortisation and depreciation (net of vehicles sold under buy-back commitments) 2,667 2,639
- Change in provisions for risks and charges and other changes (640) (474)
Cash flows from (used in) operating activities during the year, net of change in working capital 4,081 3,316
- Change in working capital 1,675 679
Cash flows from (used in) operating activities during the year 5,756 3,995
- Investments in tangible and intangible assets (net of vehicles sold under buy-back commitments) (3,666) (2,854)
Cash flows from (used in) operating activities during the year, net of capital expenditures 2,090 1,141
- Change in the scope of consolidation and other changes 647 255
Net cash flows from (used in) industrial activities excluding capital contributions and dividends paid 2,737 1,396
- Capital increases, (purchase) disposal of treasury stock and dividends (700) (1)
- Translation exchange differences 91 51
Change in net industrial debt 2,128 1,446
Net industrial (debt)/cash position at end of the year 355 (1,773)
In 2007 net industrial debt turned to a net cash position mainly
as a result of positive operating performance and at December
31, 2007, net cash amounted to 355 million euros; the overall
change was equal to 2,128 million euros.
Cash flows generated by operating activities during the period
was positive by 5,756 million euros (of which 1,675 million
euros attributable to the decrease in working capital) and more
than offset industrial capital expenditures for the period
totalling 3,666 million euros.
The item Change in the scope of consolidation and other
changes includes in particular the proceeds from the sale of
the interest held in Mediobanca, the sale of Ingest Facility and
Meridian Technologies, the final payment received on the sale
of 51% of FAFS, which took place at the end of 2006, and that
realized within the framework of the creation of the 50-50 joint
venture with Tata Motors in India previously described.
In 2007 the Group distributed dividends for 310 million euros
to its stockholders and to minorities of its subsidiaries, and
repurchased shares for a total amount of 395 million euros (net
of treasury shares sold).