Chrysler 2007 Annual Report Download - page 41
Download and view the complete annual report
Please find page 41 of the 2007 Chrysler annual report below. You can navigate through the pages in the report by either clicking on the pages listed below, or by using the keyword search tool below to find specific information within the annual report.-
 1
1 -
2
-
3
-
4
-
5
-
6
-
7
-
8
-
9
-
10
-
11
-
12
-
13
-
14
-
15
-
16
-
17
-
18
-
19
-
20
-
21
-
22
-
23
-
24
-
25
-
26
-
27
-
28
-
29
-
30
-
 31
31 -
 32
32 -
 33
33 -
 34
34 -
 35
35 -
 36
36 -
 37
37 -
 38
38 -
 39
39 -
 40
40 -
 41
41 -
 42
42 -
 43
43 -
 44
44 -
 45
45 -
 46
46 -
 47
47 -
 48
48 -
 49
49 -
 50
50 -
 51
51 -
52
-
53
-
54
-
55
-
56
-
57
-
58
-
59
-
60
-
61
-
62
-
63
-
64
-
65
-
66
-
67
-
68
-
69
-
70
-
71
-
72
-
73
-
74
-
75
-
76
-
77
-
78
-
79
-
80
-
81
-
82
-
83
-
84
-
85
-
86
-
87
-
88
-
89
-
90
-
91
-
92
-
93
-
94
-
95
-
96
-
97
-
98
-
99
-
100
-
101
-
102
-
103
-
104
-
105
-
106
-
107
-
108
-
109
-
110
-
111
-
112
-
113
-
114
-
115
-
116
-
117
-
118
-
119
-
120
-
121
-
122
-
123
-
124
-
125
-
126
-
127
-
128
-
129
-
130
-
131
-
132
-
133
-
134
-
135
-
136
-
137
-
138
-
139
-
140
-
141
-
142
-
143
-
144
-
145
-
146
-
147
-
148
-
149
-
150
-
151
-
152
-
153
-
154
-
155
-
156
-
157
-
158
-
159
-
160
-
161
-
162
-
163
-
164
-
165
-
166
-
167
-
168
-
169
-
170
-
171
-
172
-
173
-
174
-
175
-
176
-
177
-
178
-
179
-
180
-
181
-
182
-
183
-
184
-
185
-
186
-
187
-
188
-
189
-
190
-
191
-
192
-
193
-
194
-
195
-
196
-
197
-
198
-
199
-
200
-
201
-
202
-
203
-
204
-
205
-
206
-
207
-
208
-
209
-
210
-
211
-
212
-
213
-
214
-
215
-
216
-
217
-
218
-
219
-
220
-
221
-
222
-
223
-
224
-
225
-
226
-
227
-
228
-
229
-
230
-
231
-
232
-
233
-
234
-
235
-
236
-
237
-
238
-
239
-
240
-
241
-
242
-
243
-
244
-
245
-
246
-
247
-
248
-
249
-
250
-
251
-
252
-
253
-
254
-
255
-
256
-
257
-
258
-
259
-
260
-
261
-
262
-
263
-
264
-
265
-
266
-
267
-
268
-
269
-
270
-
271
-
272
-
273
-
274
-
275
-
276
-
277
-
278
-
279
-
280
-
281
-
282
-
283
-
284
-
285
-
286
-
287
-
288
-
289
-
290
-
291
-
292
-
293
-
294
-
295
-
296
-
297
-
298
-
299
-
300
-
301
-
302
-
303
-
304
-
305
-
306
-
307
-
308
-
309
-
310
-
311
-
312
-
313
-
314
-
315
-
316
-
317
-
318
-
319
-
320
-
321
-
322
-
323
-
324
-
325
-
326
-
327
-
328
-
329
-
330
-
331
-
332
-
333
-
334
-
335
-
336
-
337
-
338
-
339
-
340
-
341
 |
 |

Report on Operations Financial Review of the Group40
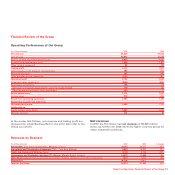
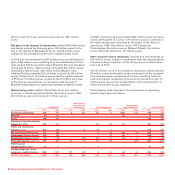
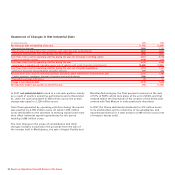
Consolidated Statement of Cash Flows
The consolidated statement of cash flows is presented as a
component of the Consolidated Financial Statements.
A condensed version thereof as well as comments are
provided below.
(in millions of euros) 2007 2006
A) Cash and cash equivalents at beginning of the year as reported 7,736 6,417
Cash and cash equivalents included under Assets held for sale 5-
B) Cash and cash equivalents at beginning of the year 7, 74 1 6,417
C) Cash flows from (used in) operating activities during the year 5,909 4,618
D) Cash flows from (used in) investment activities (a) (4,601) (1,390)
E) Cash flows from (used in) financing activities (2,375) (1,731)
Translation exchange differences (33) (173)
F) Total change in cash and cash equivalents (1,100) 1,324
G) Cash and cash equivalents at end of the year 6,641 7, 74 1
of which: Cash and cash equivalents included under Assets held for sale 25
H) Cash and cash equivalents at end of the year as reported in the Consolidated Financial Statements 6,639 7,736
(a) In 2006, the reimbursement of loans extended by the Group’s centralised cash management to the financial services companies transferred to the FAFS joint venture had determined proceeds
of approximately 3 billion euros.
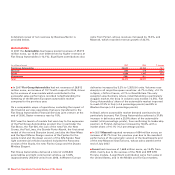
In 2007, cash flows from operating activities during the year
totalled 5,909 million euros.
Income cash flow, that is net income plus amortisation and
depreciation, dividends, changes in provisions and items
related to sales with buy-back commitments, net of
Gains/losses on disposal and other non-cash items, amounted
to 4,321 million euros, to which should be added the cash
generated by the decrease in working capital which, when
calculated on a comparable consolidation and exchange rate
basis, amounted to 1,588 million euros.
Cash flows used in investment activities totalled 4,601 million
euros. Net of the increase in securities held as current assets
(63 million euros), which mainly represent a temporary
investment of funds, investments activities used a total of
4,538 million euros.
Investments in tangible assets (net of vehicles sold with buy-back
commitments) and intangible assets totalled 3,985 million euros
(3,789 million euros in 2006) of which 302 million euros (926
million euros in 2006, 750 million euros of which relating to
activities performed in 2007 by FAFS) referred to vehicles for long-
term renting operations while 932 million euros (813 million euros
in 2006) referred to capitalised development costs.
In addition to investments, receivables from financing activities
increased (1,032 million euros) mainly due to growth in financing
extended by the financial services companies of CNH - Case New
Holland, partly offset by the decrease in financing activities
performed by the financial services companies of Fiat Group
Automobiles that were not conveyed to Fiat Group Automobiles
Financial Services at the end of 2006.
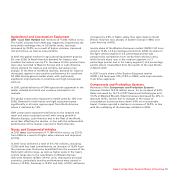
In 2007, the sale of non-current assets determined net proceeds
of 735 million euros, which relate mainly to the sale of the
interest held in Mediobanca (225 million euros), the sale of
Meridian Technologies Inc. (Metallurgical Products Sector
– 55 million euros) and Ingest Facility (included in the Services
Sector until the end of 2006 – 49 million euros), the final
payment received on the sale of 51% of FAFS which took place
at the end of 2006 (85 million euros) and the payment received
within the framework of the creation of the 50-50 joint venture
with Tata Motors in India (28 million euros), as well as the
proceeds from the sales of vehicles as part of the long-term
renting operations (54 million euros) and of other tangible and
intangible assets.
Cash flows used in financing activities totalled 2,375 million
euros mainly due to the reduction of debt for approximately
1.7 billion euros (1 billion euros of which relate to asset-backed
financing), the payment of dividends (310 million euros,
36 million euros of which to minority stockholders of Group
companies) as well as the purchase of treasury stock as part of