Chrysler 2007 Annual Report Download - page 36
Download and view the complete annual report
Please find page 36 of the 2007 Chrysler annual report below. You can navigate through the pages in the report by either clicking on the pages listed below, or by using the keyword search tool below to find specific information within the annual report.-
 1
1 -
2
-
3
-
4
-
5
-
6
-
7
-
8
-
9
-
10
-
11
-
12
-
13
-
14
-
15
-
16
-
17
-
18
-
19
-
20
-
21
-
22
-
23
-
24
-
25
-
 26
26 -
 27
27 -
 28
28 -
 29
29 -
 30
30 -
 31
31 -
 32
32 -
 33
33 -
 34
34 -
 35
35 -
 36
36 -
 37
37 -
 38
38 -
 39
39 -
 40
40 -
 41
41 -
 42
42 -
 43
43 -
 44
44 -
 45
45 -
 46
46 -
47
-
48
-
49
-
50
-
51
-
52
-
53
-
54
-
55
-
56
-
57
-
58
-
59
-
60
-
61
-
62
-
63
-
64
-
65
-
66
-
67
-
68
-
69
-
70
-
71
-
72
-
73
-
74
-
75
-
76
-
77
-
78
-
79
-
80
-
81
-
82
-
83
-
84
-
85
-
86
-
87
-
88
-
89
-
90
-
91
-
92
-
93
-
94
-
95
-
96
-
97
-
98
-
99
-
100
-
101
-
102
-
103
-
104
-
105
-
106
-
107
-
108
-
109
-
110
-
111
-
112
-
113
-
114
-
115
-
116
-
117
-
118
-
119
-
120
-
121
-
122
-
123
-
124
-
125
-
126
-
127
-
128
-
129
-
130
-
131
-
132
-
133
-
134
-
135
-
136
-
137
-
138
-
139
-
140
-
141
-
142
-
143
-
144
-
145
-
146
-
147
-
148
-
149
-
150
-
151
-
152
-
153
-
154
-
155
-
156
-
157
-
158
-
159
-
160
-
161
-
162
-
163
-
164
-
165
-
166
-
167
-
168
-
169
-
170
-
171
-
172
-
173
-
174
-
175
-
176
-
177
-
178
-
179
-
180
-
181
-
182
-
183
-
184
-
185
-
186
-
187
-
188
-
189
-
190
-
191
-
192
-
193
-
194
-
195
-
196
-
197
-
198
-
199
-
200
-
201
-
202
-
203
-
204
-
205
-
206
-
207
-
208
-
209
-
210
-
211
-
212
-
213
-
214
-
215
-
216
-
217
-
218
-
219
-
220
-
221
-
222
-
223
-
224
-
225
-
226
-
227
-
228
-
229
-
230
-
231
-
232
-
233
-
234
-
235
-
236
-
237
-
238
-
239
-
240
-
241
-
242
-
243
-
244
-
245
-
246
-
247
-
248
-
249
-
250
-
251
-
252
-
253
-
254
-
255
-
256
-
257
-
258
-
259
-
260
-
261
-
262
-
263
-
264
-
265
-
266
-
267
-
268
-
269
-
270
-
271
-
272
-
273
-
274
-
275
-
276
-
277
-
278
-
279
-
280
-
281
-
282
-
283
-
284
-
285
-
286
-
287
-
288
-
289
-
290
-
291
-
292
-
293
-
294
-
295
-
296
-
297
-
298
-
299
-
300
-
301
-
302
-
303
-
304
-
305
-
306
-
307
-
308
-
309
-
310
-
311
-
312
-
313
-
314
-
315
-
316
-
317
-
318
-
319
-
320
-
321
-
322
-
323
-
324
-
325
-
326
-
327
-
328
-
329
-
330
-
331
-
332
-
333
-
334
-
335
-
336
-
337
-
338
-
339
-
340
-
341
 |
 |

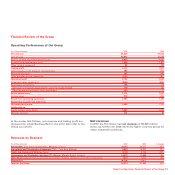
(in millions of euros) 2007 2006 % change
Publishing and Communications (Itedi) 391 401 -2.5
Holding companies and Other companies 987 1 , 11 2 - 11. 2
Total 1,378 1,513 -8.9
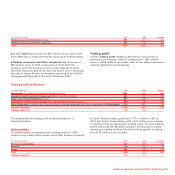
Trading profit by Business
(in millions of euros) 2007 2006 Change
Automobiles (Fiat Group Automobiles, Maserati, Ferrari) 1,093 441 652
Agricultural and Construction Equipment (CNH - Case New Holland) 990 737 253
Trucks and Commercial Vehicles (Iveco) 813 546 267
Components and Production Systems (FPT, Magneti Marelli, Teksid, Comau) 509 348 161
Other Businesses (Publishing and Communications, Holding companies and Other companies) and Eliminations (172) (121) -51
Total for the Group 3,233 1,951 1,282
Trading margin (%) 5.5 3.8
Report on Operations Financial Review of the Group 35
■In 2007 Itedi had revenues of 391 million euros, down 2.5%
from 2006 due to lower advertising revenues at Publikompass.
■Holding companies and Other companies had revenues of
987 million euros in 2007, a decrease of 11.2% from the
previous year. The decrease is due to the disposal of some
activities that belonged to the Services Sector and in particular
the sale of Ingest Facility (a company operating in the facility
management business) at the end of February 2007.
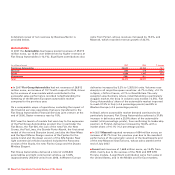
Trading profit
In 2007, trading profit totalled 3,233 million euros (5.5% of
revenues), an increase of 65.7% compared to 1,951 million
euros in 2006 (3.8% of revenues), with all the major businesses
posting significant improvements.
The breakdown of trading profit by Business/Sector is
illustrated below:
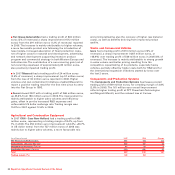
Automobiles
The Automobiles businesses had a trading profit of 1,093
million euros (+652 million euros) more than double compared
to 2006. Trading margin grew from 1.7% in 2006 to 3.8% in
2007. Fiat Group Automobiles, with a 512 million euro increase
in trading profit, almost tripled its 2006 result. Ferrari’s trading
profit rose by 45.4%. Maserati posted a turnaround in results,
reporting a trading profit of 24 million euros against a trading
loss of 33 million euros in 2006.
(in millions of euros) 2007 2006 % change
Fiat Group Automobiles 803 291 512
Maserati 24 (33) 57
Ferrari 266 183 83
Total 1,093 441 652
Trading margin (%) 3.8 1.7