Chrysler 2007 Annual Report Download - page 32
Download and view the complete annual report
Please find page 32 of the 2007 Chrysler annual report below. You can navigate through the pages in the report by either clicking on the pages listed below, or by using the keyword search tool below to find specific information within the annual report.-
 1
1 -
2
-
3
-
4
-
5
-
6
-
7
-
8
-
9
-
10
-
11
-
12
-
13
-
14
-
15
-
16
-
17
-
18
-
19
-
20
-
21
-
 22
22 -
 23
23 -
 24
24 -
 25
25 -
 26
26 -
 27
27 -
 28
28 -
 29
29 -
 30
30 -
 31
31 -
 32
32 -
 33
33 -
 34
34 -
 35
35 -
 36
36 -
 37
37 -
 38
38 -
 39
39 -
 40
40 -
 41
41 -
 42
42 -
43
-
44
-
45
-
46
-
47
-
48
-
49
-
50
-
51
-
52
-
53
-
54
-
55
-
56
-
57
-
58
-
59
-
60
-
61
-
62
-
63
-
64
-
65
-
66
-
67
-
68
-
69
-
70
-
71
-
72
-
73
-
74
-
75
-
76
-
77
-
78
-
79
-
80
-
81
-
82
-
83
-
84
-
85
-
86
-
87
-
88
-
89
-
90
-
91
-
92
-
93
-
94
-
95
-
96
-
97
-
98
-
99
-
100
-
101
-
102
-
103
-
104
-
105
-
106
-
107
-
108
-
109
-
110
-
111
-
112
-
113
-
114
-
115
-
116
-
117
-
118
-
119
-
120
-
121
-
122
-
123
-
124
-
125
-
126
-
127
-
128
-
129
-
130
-
131
-
132
-
133
-
134
-
135
-
136
-
137
-
138
-
139
-
140
-
141
-
142
-
143
-
144
-
145
-
146
-
147
-
148
-
149
-
150
-
151
-
152
-
153
-
154
-
155
-
156
-
157
-
158
-
159
-
160
-
161
-
162
-
163
-
164
-
165
-
166
-
167
-
168
-
169
-
170
-
171
-
172
-
173
-
174
-
175
-
176
-
177
-
178
-
179
-
180
-
181
-
182
-
183
-
184
-
185
-
186
-
187
-
188
-
189
-
190
-
191
-
192
-
193
-
194
-
195
-
196
-
197
-
198
-
199
-
200
-
201
-
202
-
203
-
204
-
205
-
206
-
207
-
208
-
209
-
210
-
211
-
212
-
213
-
214
-
215
-
216
-
217
-
218
-
219
-
220
-
221
-
222
-
223
-
224
-
225
-
226
-
227
-
228
-
229
-
230
-
231
-
232
-
233
-
234
-
235
-
236
-
237
-
238
-
239
-
240
-
241
-
242
-
243
-
244
-
245
-
246
-
247
-
248
-
249
-
250
-
251
-
252
-
253
-
254
-
255
-
256
-
257
-
258
-
259
-
260
-
261
-
262
-
263
-
264
-
265
-
266
-
267
-
268
-
269
-
270
-
271
-
272
-
273
-
274
-
275
-
276
-
277
-
278
-
279
-
280
-
281
-
282
-
283
-
284
-
285
-
286
-
287
-
288
-
289
-
290
-
291
-
292
-
293
-
294
-
295
-
296
-
297
-
298
-
299
-
300
-
301
-
302
-
303
-
304
-
305
-
306
-
307
-
308
-
309
-
310
-
311
-
312
-
313
-
314
-
315
-
316
-
317
-
318
-
319
-
320
-
321
-
322
-
323
-
324
-
325
-
326
-
327
-
328
-
329
-
330
-
331
-
332
-
333
-
334
-
335
-
336
-
337
-
338
-
339
-
340
-
341
 |
 |

Financial Review of the Group
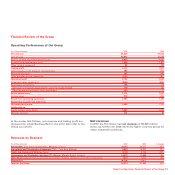
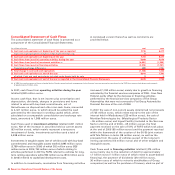
Operating Performance of the Group
(in millions of euros) 2007 2006
Net revenues 58,529 51,832
Cost of sales 48,924 43,888
Selling, general and administrative costs 4,924 4,697
Research and development costs 1,536 1,401
Other income (expenses) 88 105
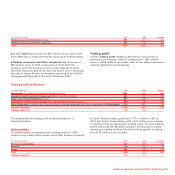
Trading profit 3,233 1,951
Gains (losses) on the disposal of investments 190 607
Restructuring costs 105 450
Other unusual income (expenses) (166) (47)
Operating result 3,152 2,061
Financial income (expenses) (564) (576)
Result from investments 185 156
- Net result of investees accounted for using the equity method 210 125
- Other income and expenses from investments (25) 31
Result before taxes 2,773 1,641
Income taxes 719 490
Result from continuing operations 2,054 1,151
Result from discontinued operations --
Net result for the year 2,054 1,151
Attributable to:
Equity holders of the Parent 1,953 1,065
Minority interests 101 86
Report on Operations Financial Review of the Group 31
In the review that follows, net revenues and trading profit are
discussed by single Business/Sector; the other data refer to the
Group as a whole.
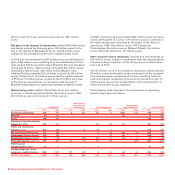
Net revenues
In 2007, the Fiat Group had net revenues of 58,529 million
euros, up 12.9% from 2006 driven by higher volumes across all
major industrial businesses.
Revenues by Business
(in millions of euros) 2007 2006 % change
Automobiles (Fiat Group Automobiles, Maserati, Ferrari) 29,015 25,577 13.4
Agricultural and Construction Equipment (CNH - Case New Holland) 11,843 10,527 12.5
Trucks and Commercial Vehicles (Iveco) 11,196 9,136 22.5
Components and Production Systems (FPT, Magneti Marelli, Teksid, Comau) 13,375 12,366 8.2
Other Businesses (Publishing and Communications, Holding companies and Other companies) 1,378 1,513 -8.9
Eliminations (8,278) (7,287) -
Total for the Group 58,529 51,832 12.9