Chrysler 2007 Annual Report Download - page 42
Download and view the complete annual report
Please find page 42 of the 2007 Chrysler annual report below. You can navigate through the pages in the report by either clicking on the pages listed below, or by using the keyword search tool below to find specific information within the annual report.-
 1
1 -
2
-
3
-
4
-
5
-
6
-
7
-
8
-
9
-
10
-
11
-
12
-
13
-
14
-
15
-
16
-
17
-
18
-
19
-
20
-
21
-
22
-
23
-
24
-
25
-
26
-
27
-
28
-
29
-
30
-
31
-
 32
32 -
 33
33 -
 34
34 -
 35
35 -
 36
36 -
 37
37 -
 38
38 -
 39
39 -
 40
40 -
 41
41 -
 42
42 -
 43
43 -
 44
44 -
 45
45 -
 46
46 -
 47
47 -
 48
48 -
 49
49 -
 50
50 -
 51
51 -
 52
52 -
53
-
54
-
55
-
56
-
57
-
58
-
59
-
60
-
61
-
62
-
63
-
64
-
65
-
66
-
67
-
68
-
69
-
70
-
71
-
72
-
73
-
74
-
75
-
76
-
77
-
78
-
79
-
80
-
81
-
82
-
83
-
84
-
85
-
86
-
87
-
88
-
89
-
90
-
91
-
92
-
93
-
94
-
95
-
96
-
97
-
98
-
99
-
100
-
101
-
102
-
103
-
104
-
105
-
106
-
107
-
108
-
109
-
110
-
111
-
112
-
113
-
114
-
115
-
116
-
117
-
118
-
119
-
120
-
121
-
122
-
123
-
124
-
125
-
126
-
127
-
128
-
129
-
130
-
131
-
132
-
133
-
134
-
135
-
136
-
137
-
138
-
139
-
140
-
141
-
142
-
143
-
144
-
145
-
146
-
147
-
148
-
149
-
150
-
151
-
152
-
153
-
154
-
155
-
156
-
157
-
158
-
159
-
160
-
161
-
162
-
163
-
164
-
165
-
166
-
167
-
168
-
169
-
170
-
171
-
172
-
173
-
174
-
175
-
176
-
177
-
178
-
179
-
180
-
181
-
182
-
183
-
184
-
185
-
186
-
187
-
188
-
189
-
190
-
191
-
192
-
193
-
194
-
195
-
196
-
197
-
198
-
199
-
200
-
201
-
202
-
203
-
204
-
205
-
206
-
207
-
208
-
209
-
210
-
211
-
212
-
213
-
214
-
215
-
216
-
217
-
218
-
219
-
220
-
221
-
222
-
223
-
224
-
225
-
226
-
227
-
228
-
229
-
230
-
231
-
232
-
233
-
234
-
235
-
236
-
237
-
238
-
239
-
240
-
241
-
242
-
243
-
244
-
245
-
246
-
247
-
248
-
249
-
250
-
251
-
252
-
253
-
254
-
255
-
256
-
257
-
258
-
259
-
260
-
261
-
262
-
263
-
264
-
265
-
266
-
267
-
268
-
269
-
270
-
271
-
272
-
273
-
274
-
275
-
276
-
277
-
278
-
279
-
280
-
281
-
282
-
283
-
284
-
285
-
286
-
287
-
288
-
289
-
290
-
291
-
292
-
293
-
294
-
295
-
296
-
297
-
298
-
299
-
300
-
301
-
302
-
303
-
304
-
305
-
306
-
307
-
308
-
309
-
310
-
311
-
312
-
313
-
314
-
315
-
316
-
317
-
318
-
319
-
320
-
321
-
322
-
323
-
324
-
325
-
326
-
327
-
328
-
329
-
330
-
331
-
332
-
333
-
334
-
335
-
336
-
337
-
338
-
339
-
340
-
341
 |
 |

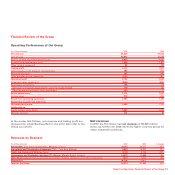
Report on Operations Financial Review of the Group 41
the buy-back programme approved by the Stockholders
Meeting in April 2007 (426 million euros), net of sales resulting
from the exercise of stock options (31 million euros).
Balance Sheet of the Group
at December 31, 2007
At December 31 2007, Total Assets amounted to 60,136 million
euros, an increase of 1,732 million euros from 58,404 million
euros at December 31, 2006*.
At the end of the period, Total Assets included assets
reclassified under Assets held for sale for 83 million euros,
mainly relating to the Production Systems Sector.
In 2007 Non-current assets increased by 934 million euros due
to the increase in:
■Property, plant and equipment (amounting to 706 million
euros), largely attributable to the positive balance of
investments, depreciation and disposals (mainly vehicles sold
by Iveco with buy-back commitments), to which should be
added the impact of changes in the scope of consolidation
(totalling approximately 170 million euros) mainly relating to
the line-by-line consolidation of the I.T.C.A. Group and Teksid
Aluminum;
■Leased assets (amounting to 149 million euros) due to higher
levels of activities at CNH financial services companies; and
■Intangible assets totalling 102 million euros. The increase of
228 million euros in Other intangible assets (mainly capitalised
development costs), largely attributable to the positive balance
of investments and depreciation, was in part offset by a
decrease in goodwill (-126 million euros), especially CNH
goodwill, whose value in euros decreased by 170 million euros
due to currency translation.
At December 31, 2007 receivables from financing activities
totalled 12,268 million euros, an increase of 525 million euros
from December 31, 2006. Net of currency translation and of
writedowns, the increase amounted to 1,032 million euros.
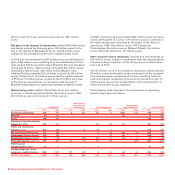
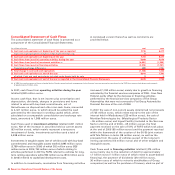
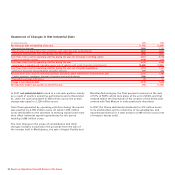
Working capital, net of items connected with the sales of
vehicles with buy-back commitments, is negative by 2,628
million euros. At December 31 2006, working capital was
negative by 838 million euros.
(in millions of euros) At 12.31.2007 At 12.31.2006 Change
Net inventories * (1) 8,958 7,654 1,304
Trade receivables 4,384 4,944 -560
Trade payables (14,725) (12,603) -2,122
Other receivables/(payables), accruals and deferrals * (2) (1,245) (833) -412
Working capital (2,628) (838) -1,790
(1) Inventories are shown net of the value of vehicles sold with buy-back commitments by Fiat Group Automobiles.
(2) Other payables included in the balance of Other receivables/(payables), accruals and deferrals exclude amounts due to customers corresponding to the buy-back price due upon expiration of the
related contracts and the amount of the fees paid in advance by customers for vehicles sold with buy-back commitments, which is equal to the difference, at the date of signing the contract, between
the sales price and the buy-back price and which is recognised over the term of the entire agreement.
At December 31, 2007 trade receivables, other receivables and
receivables from financing activities falling due after that date
and sold without recourse and therefore eliminated from the
balance sheet in compliance with IAS 39 derecognition
requirements, totalled 7,044 million euros (5,697 million euros
at December 31, 2006). This amount includes receivables,
mainly from the sales network, sold to jointly-controlled
financial services companies (FAFS) for 3,817 million euros
(3,400 million euros at December 31, 2006) and associated
financial services companies (Iveco Financial Services,
controlled by Barclays) for 869 million euros (661 million euros
at December 31, 2006). The increases recorded during the fiscal
year are mainly due to higher levels of activity.
* The balance at December 31, 2006 differs from that previously published as the result of the reclassification of 101 million euros described in the Notes to the Consolidated Financial Statements (in the
paragraph Other information).