Chrysler 2007 Annual Report Download - page 38
Download and view the complete annual report
Please find page 38 of the 2007 Chrysler annual report below. You can navigate through the pages in the report by either clicking on the pages listed below, or by using the keyword search tool below to find specific information within the annual report.-
 1
1 -
2
-
3
-
4
-
5
-
6
-
7
-
8
-
9
-
10
-
11
-
12
-
13
-
14
-
15
-
16
-
17
-
18
-
19
-
20
-
21
-
22
-
23
-
24
-
25
-
26
-
27
-
 28
28 -
 29
29 -
 30
30 -
 31
31 -
 32
32 -
 33
33 -
 34
34 -
 35
35 -
 36
36 -
 37
37 -
 38
38 -
 39
39 -
 40
40 -
 41
41 -
 42
42 -
 43
43 -
 44
44 -
 45
45 -
 46
46 -
 47
47 -
 48
48 -
49
-
50
-
51
-
52
-
53
-
54
-
55
-
56
-
57
-
58
-
59
-
60
-
61
-
62
-
63
-
64
-
65
-
66
-
67
-
68
-
69
-
70
-
71
-
72
-
73
-
74
-
75
-
76
-
77
-
78
-
79
-
80
-
81
-
82
-
83
-
84
-
85
-
86
-
87
-
88
-
89
-
90
-
91
-
92
-
93
-
94
-
95
-
96
-
97
-
98
-
99
-
100
-
101
-
102
-
103
-
104
-
105
-
106
-
107
-
108
-
109
-
110
-
111
-
112
-
113
-
114
-
115
-
116
-
117
-
118
-
119
-
120
-
121
-
122
-
123
-
124
-
125
-
126
-
127
-
128
-
129
-
130
-
131
-
132
-
133
-
134
-
135
-
136
-
137
-
138
-
139
-
140
-
141
-
142
-
143
-
144
-
145
-
146
-
147
-
148
-
149
-
150
-
151
-
152
-
153
-
154
-
155
-
156
-
157
-
158
-
159
-
160
-
161
-
162
-
163
-
164
-
165
-
166
-
167
-
168
-
169
-
170
-
171
-
172
-
173
-
174
-
175
-
176
-
177
-
178
-
179
-
180
-
181
-
182
-
183
-
184
-
185
-
186
-
187
-
188
-
189
-
190
-
191
-
192
-
193
-
194
-
195
-
196
-
197
-
198
-
199
-
200
-
201
-
202
-
203
-
204
-
205
-
206
-
207
-
208
-
209
-
210
-
211
-
212
-
213
-
214
-
215
-
216
-
217
-
218
-
219
-
220
-
221
-
222
-
223
-
224
-
225
-
226
-
227
-
228
-
229
-
230
-
231
-
232
-
233
-
234
-
235
-
236
-
237
-
238
-
239
-
240
-
241
-
242
-
243
-
244
-
245
-
246
-
247
-
248
-
249
-
250
-
251
-
252
-
253
-
254
-
255
-
256
-
257
-
258
-
259
-
260
-
261
-
262
-
263
-
264
-
265
-
266
-
267
-
268
-
269
-
270
-
271
-
272
-
273
-
274
-
275
-
276
-
277
-
278
-
279
-
280
-
281
-
282
-
283
-
284
-
285
-
286
-
287
-
288
-
289
-
290
-
291
-
292
-
293
-
294
-
295
-
296
-
297
-
298
-
299
-
300
-
301
-
302
-
303
-
304
-
305
-
306
-
307
-
308
-
309
-
310
-
311
-
312
-
313
-
314
-
315
-
316
-
317
-
318
-
319
-
320
-
321
-
322
-
323
-
324
-
325
-
326
-
327
-
328
-
329
-
330
-
331
-
332
-
333
-
334
-
335
-
336
-
337
-
338
-
339
-
340
-
341
 |
 |

Report on Operations Financial Review of the Group 37
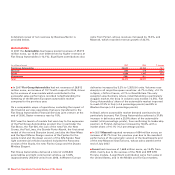
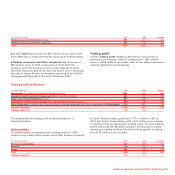
■In 2007, FPT Powertrain Technologies had a trading profit of
271 million euros, an increase of 103 million euros (+61.3%)
over 2006, resulting in an improvement in trading margin from
2.7% in 2006 to 3.8% in 2007. The improvement is mainly due
to efficiencies in the purchasing and manufacturing areas and
growth in volume, while higher costs for international business
development negatively impacted trading results.
■Magneti Marelli had a trading profit of 214 million euros, an
increase of 24 million euros compared to 2006. Higher sales
volumes and efficiency gains compensated price pressures,
increased raw material prices and industrial start-up costs for
new products. Trading margin was 4.3%, in line with 2006.
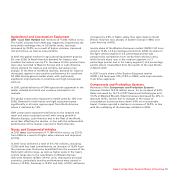
■Teksid closed 2007 with a trading profit of 47 million euros,
which was impacted by the trading loss of 9 million euros of
Teksid Aluminum, against a profit of 56 million euros in 2006,
which included the positive result of 16 million euros relating
to sold activities. On a comparable scope of operations, trading
profit improved by 16 million euros due to efficiency gains,
which more than offset higher energy and materials costs.
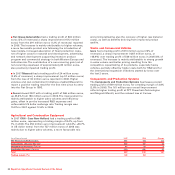
■Comau closed 2007 with a trading loss of 23 million euros
(reported in the first quarter of 2007 and followed by
substantial breakeven in the rest of the year), a substantial
improvement from the loss of 66 million euros reported in
2006. The improvement is the result of the reshaping plan
launched in the second half of 2006, the effects of which are
starting to be felt. The most important improvements were
reported by the Body-welding operations in Europe.
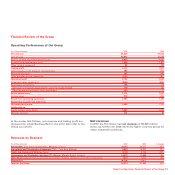
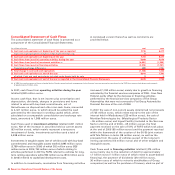
Other Businesses
The trading loss reported by the Other Businesses totalled 172
million euros, compared with a trading loss of 121 million
euros in 2006.
■In 2007, Itedi had a trading profit of 12 million euros (3.1% of
revenues), against a profit of 11 million euros in 2006 (2.7% of
revenues). The improvement is mainly attributable to general,
industrial and distribution cost-containment initiatives at
Editrice La Stampa (whose trading margin rose by 2
percentage points), notwithstanding higher amortization
connected to the new rotary press project and the termination
of government paper cost subsidies.
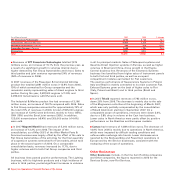
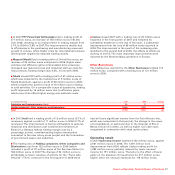
■The trading loss of Holding companies, Other companies and
Eliminations rose from 132 million euros in 2006 (which
included a profit of 37 million euros of the Services Sector) to
184 million euros in 2007. The change of 52 million euros is
attributable to lower volumes of activity for the “Treno Alta
Velocità” (T.A.V.) contract (in the first quarter of 2006 there
had still been significant income from the Turin-Novara line,
which was completed in that period), the change in the scope
of consolidation, in particular due to the disposal of B.U.C. -
Banca Unione di Credito, as well as higher non-cash costs
recognised in connection with stock option plans.
Operating result
In 2007 Operating income totalled 3,152 million euros, against
2,061 million euros in 2006. The 1,091 million euro
improvement from 2006 reflects higher trading profit for
1,282 million euros, partially reduced by lower unusual
income for 191 million euros. The latter is the effect of lower
gains on the disposal of investments for 417 million euros,
higher other net unusual expenses for 119 million euros,
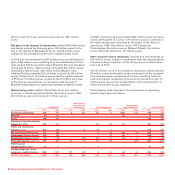
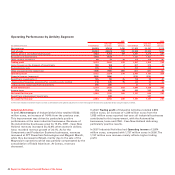
(in millions of euros) 2007 2006 Change
Publishing and Communications (Itedi) 12 11 1
Holding companies, Other companies and Eliminations (184) (132) -52
Total (172) (121) -51