Chrysler 2007 Annual Report Download - page 161
Download and view the complete annual report
Please find page 161 of the 2007 Chrysler annual report below. You can navigate through the pages in the report by either clicking on the pages listed below, or by using the keyword search tool below to find specific information within the annual report.-
 1
1 -
2
-
3
-
4
-
5
-
6
-
7
-
8
-
9
-
10
-
11
-
12
-
13
-
14
-
15
-
16
-
17
-
18
-
19
-
20
-
21
-
22
-
23
-
24
-
25
-
26
-
27
-
28
-
29
-
30
-
31
-
32
-
33
-
34
-
35
-
36
-
37
-
38
-
39
-
40
-
41
-
42
-
43
-
44
-
45
-
46
-
47
-
48
-
49
-
50
-
51
-
52
-
53
-
54
-
55
-
56
-
57
-
58
-
59
-
60
-
61
-
62
-
63
-
64
-
65
-
66
-
67
-
68
-
69
-
70
-
71
-
72
-
73
-
74
-
75
-
76
-
77
-
78
-
79
-
80
-
81
-
82
-
83
-
84
-
85
-
86
-
87
-
88
-
89
-
90
-
91
-
92
-
93
-
94
-
95
-
96
-
97
-
98
-
99
-
100
-
101
-
102
-
103
-
104
-
105
-
106
-
107
-
108
-
109
-
110
-
111
-
112
-
113
-
114
-
115
-
116
-
117
-
118
-
119
-
120
-
121
-
122
-
123
-
124
-
125
-
126
-
127
-
128
-
129
-
130
-
131
-
132
-
133
-
134
-
135
-
136
-
137
-
138
-
139
-
140
-
141
-
142
-
143
-
144
-
145
-
146
-
147
-
148
-
149
-
150
-
 151
151 -
 152
152 -
 153
153 -
 154
154 -
 155
155 -
 156
156 -
 157
157 -
 158
158 -
 159
159 -
 160
160 -
 161
161 -
 162
162 -
 163
163 -
 164
164 -
 165
165 -
 166
166 -
 167
167 -
 168
168 -
 169
169 -
 170
170 -
 171
171 -
172
-
173
-
174
-
175
-
176
-
177
-
178
-
179
-
180
-
181
-
182
-
183
-
184
-
185
-
186
-
187
-
188
-
189
-
190
-
191
-
192
-
193
-
194
-
195
-
196
-
197
-
198
-
199
-
200
-
201
-
202
-
203
-
204
-
205
-
206
-
207
-
208
-
209
-
210
-
211
-
212
-
213
-
214
-
215
-
216
-
217
-
218
-
219
-
220
-
221
-
222
-
223
-
224
-
225
-
226
-
227
-
228
-
229
-
230
-
231
-
232
-
233
-
234
-
235
-
236
-
237
-
238
-
239
-
240
-
241
-
242
-
243
-
244
-
245
-
246
-
247
-
248
-
249
-
250
-
251
-
252
-
253
-
254
-
255
-
256
-
257
-
258
-
259
-
260
-
261
-
262
-
263
-
264
-
265
-
266
-
267
-
268
-
269
-
270
-
271
-
272
-
273
-
274
-
275
-
276
-
277
-
278
-
279
-
280
-
281
-
282
-
283
-
284
-
285
-
286
-
287
-
288
-
289
-
290
-
291
-
292
-
293
-
294
-
295
-
296
-
297
-
298
-
299
-
300
-
301
-
302
-
303
-
304
-
305
-
306
-
307
-
308
-
309
-
310
-
311
-
312
-
313
-
314
-
315
-
316
-
317
-
318
-
319
-
320
-
321
-
322
-
323
-
324
-
325
-
326
-
327
-
328
-
329
-
330
-
331
-
332
-
333
-
334
-
335
-
336
-
337
-
338
-
339
-
340
-
341
 |
 |

160 Fiat Group Consolidated Financial Statements at December 31, 2007 - Notes
In 2004, a LTI award for which payout was tied to the achievement of specified performance objectives was approved under the
CNH EIP for selected key employees and executive officers. This award for the 2004-2006 performance cycle provided an
opportunity to receive an accelerated payment of 50% of the targeted award after the first two years of the performance cycle.
Objectives for the first two years of the performance cycle were met and an accelerated payment of cash and 66,252 shares were
issued in 2006. Ultimately, the cumulative results for the 2004-2006 performance cycle were achieved and the remaining award was
issued in early 2007.
A second 3 year LTI award for the 2005-2007 performance cycle was granted in 2005. The results for the 2005-2007 performance cycle
were partially achieved and the award was issued in early 2008 upon approval of the 2007 results by the Board of Directors of CNH.
In connection with the new performance-based plans which were approved in 2006, CNH granted approximately 2.2 million
performance based, non-vested share awards under the CNH EIP to approximately 200 of the Sector’s top executives. These
performance shares, will vest if specified targets are achieved in 2008, 2009, or 2010. The number of shares that vest will decrease
by 20% each year if the specified targets are not achieved. If specified targets are not achieved by 2010, the shares granted will not
vest. The fair value of this award ranges from $26.27 to $27.35 per share depending on the service period over which the award
ultimately vests. Depending on the period during which targets are achieved, the estimated expense over the service period can
range from approximately $23 million to $44 million (current estimate is $33 million).
In 2007, CNH granted 240,500 performance based, non-vested share awards under the same terms as the 2006 award. The fair value
of these awards ranges from $60.24 to $61.78 per share depending on the service period over which the award ultimately vests.
Depending on the period during which targets are achieved, the estimated expense over the service period can range from
approximately $8 million to $14 million (current estimate is $11 million).
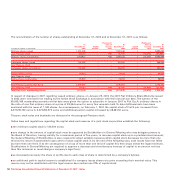
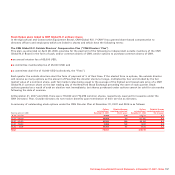
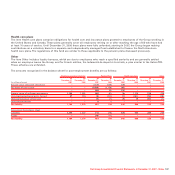
The following table summarizes the outstanding performance shares under the CNH EIP as of December 31, 2007:
2007 award 2006 award 2005 award 2004 award
Granted 240,500 4,325,000 195,946 235,134
Cancelled – (2,162,500) – –
Vested – – – (111,551)
Forfeited – (477,500) (109,656) (123,583)
Outstanding 240,500 1,685,000 86,290 –
As of December 31, 2007, there were 9,916,370 CNH Global N.V. common shares (10,642,793 CNH Global N.V. common stock shares
at December 31, 2006) available for issue under the CNH EIP.
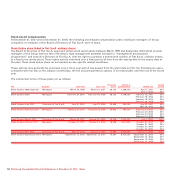
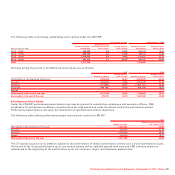
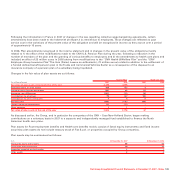
The Black-Scholes pricing model was used to calculate the fair value of stock options by CNH – Case New Holland Sector.
The weighted-average assumptions used under the Black-Scholes pricing model were as follows:
2007 2006
Directors’ Equity incentive Directors’ Equity incentive
plan plan plan plan
Option life (years) 5453.25
Expected volatility of CNH Global N.V. shares (%) 44.56 38.3 71.0 34.7
Expected dividend yield (%) 1.1 1.0 1. 3 1.3
Risk-free interest rate (%) 4.3 4.4 4.8 4.5