Chrysler 2007 Annual Report Download - page 49
Download and view the complete annual report
Please find page 49 of the 2007 Chrysler annual report below. You can navigate through the pages in the report by either clicking on the pages listed below, or by using the keyword search tool below to find specific information within the annual report.-
 1
1 -
2
-
3
-
4
-
5
-
6
-
7
-
8
-
9
-
10
-
11
-
12
-
13
-
14
-
15
-
16
-
17
-
18
-
19
-
20
-
21
-
22
-
23
-
24
-
25
-
26
-
27
-
28
-
29
-
30
-
31
-
32
-
33
-
34
-
35
-
36
-
37
-
38
-
 39
39 -
 40
40 -
 41
41 -
 42
42 -
 43
43 -
 44
44 -
 45
45 -
 46
46 -
 47
47 -
 48
48 -
 49
49 -
 50
50 -
 51
51 -
 52
52 -
 53
53 -
 54
54 -
 55
55 -
 56
56 -
 57
57 -
 58
58 -
 59
59 -
60
-
61
-
62
-
63
-
64
-
65
-
66
-
67
-
68
-
69
-
70
-
71
-
72
-
73
-
74
-
75
-
76
-
77
-
78
-
79
-
80
-
81
-
82
-
83
-
84
-
85
-
86
-
87
-
88
-
89
-
90
-
91
-
92
-
93
-
94
-
95
-
96
-
97
-
98
-
99
-
100
-
101
-
102
-
103
-
104
-
105
-
106
-
107
-
108
-
109
-
110
-
111
-
112
-
113
-
114
-
115
-
116
-
117
-
118
-
119
-
120
-
121
-
122
-
123
-
124
-
125
-
126
-
127
-
128
-
129
-
130
-
131
-
132
-
133
-
134
-
135
-
136
-
137
-
138
-
139
-
140
-
141
-
142
-
143
-
144
-
145
-
146
-
147
-
148
-
149
-
150
-
151
-
152
-
153
-
154
-
155
-
156
-
157
-
158
-
159
-
160
-
161
-
162
-
163
-
164
-
165
-
166
-
167
-
168
-
169
-
170
-
171
-
172
-
173
-
174
-
175
-
176
-
177
-
178
-
179
-
180
-
181
-
182
-
183
-
184
-
185
-
186
-
187
-
188
-
189
-
190
-
191
-
192
-
193
-
194
-
195
-
196
-
197
-
198
-
199
-
200
-
201
-
202
-
203
-
204
-
205
-
206
-
207
-
208
-
209
-
210
-
211
-
212
-
213
-
214
-
215
-
216
-
217
-
218
-
219
-
220
-
221
-
222
-
223
-
224
-
225
-
226
-
227
-
228
-
229
-
230
-
231
-
232
-
233
-
234
-
235
-
236
-
237
-
238
-
239
-
240
-
241
-
242
-
243
-
244
-
245
-
246
-
247
-
248
-
249
-
250
-
251
-
252
-
253
-
254
-
255
-
256
-
257
-
258
-
259
-
260
-
261
-
262
-
263
-
264
-
265
-
266
-
267
-
268
-
269
-
270
-
271
-
272
-
273
-
274
-
275
-
276
-
277
-
278
-
279
-
280
-
281
-
282
-
283
-
284
-
285
-
286
-
287
-
288
-
289
-
290
-
291
-
292
-
293
-
294
-
295
-
296
-
297
-
298
-
299
-
300
-
301
-
302
-
303
-
304
-
305
-
306
-
307
-
308
-
309
-
310
-
311
-
312
-
313
-
314
-
315
-
316
-
317
-
318
-
319
-
320
-
321
-
322
-
323
-
324
-
325
-
326
-
327
-
328
-
329
-
330
-
331
-
332
-
333
-
334
-
335
-
336
-
337
-
338
-
339
-
340
-
341
 |
 |

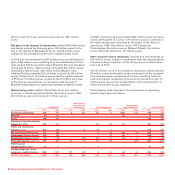
Report on Operations Financial Review of the Group48
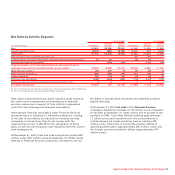
Balance Sheet by Activity Segment
At 12.31.2007 At 12.31.2006
Industrial Financial Industrial Financial
(in millions of euros) Consolidated Activities Activities Consolidated Activities Activities
Intangible assets 6,523 6,420 103 6,421 6,325 96
- Goodwill 2,724 2,635 89 2,850 2,756 94
- Other intangible assets 3,799 3,785 14 3,571 3,569 2
Property, plant and equipment 11,246 11,239 7 10,540 10,528 12
Investment property 10 10 - 19 19 -
Investments and other financial assets 2,214 4,339 918 2,280 3,886 867
Leased assets 396 8 388 247 7 240
Defined benefit plan assets 31 29 2 11 11 -
Deferred tax assets 1,892 1,708 184 1,860 1,710 150
Total Non-current assets 22,312 23,753 1,602 21,378 22,486 1,365
Inventories (*) 9,990 9,929 61 8,548 8,491 57
Trade receivables 4,384 4,444 324 4,944 5,068 178
Receivables from financing activities 12,268 4,606 12,211 11,743 2,891 11,977
Other receivables: 3,203 3,052 177 2,839 2,806 58
- Current tax receivables 1,153 1,141 14 808 798 11
- Others 2,050 1,911 163 2,031 2,008 47
Accrued income and prepaid expenses 241 224 17 247 226 21
Current financial assets: 1,016 845 171 637 531 106
- Current investments 22 22 - 31 31 -
- Current securities 291 136 155 224 134 90
- Other financial assets 703 687 16 382 366 16
Cash and cash equivalents 6,639 5,546 1,093 7,736 6,706 1,030
Total Current assets 37,741 28,646 14,054 36,694 26,719 13,427
Assets held for sale 83 83 - 332 332 -
TOTAL ASSETS 60,136 52,482 15,656 58,404 49,537 14,792
Total Assets adjusted for asset-backed financing transactions 53,316 51,799 9,507 50,060 48,605 7,313
Stockholders’ equity 11,279 11,279 2,486 10,036 10,036 2,395
Provisions: 8,562 8,369 193 8,611 8,471 140
- Employee benefits 3,597 3,581 16 3,761 3,750 11
- Other provisions 4,965 4,788 177 4,850 4,721 129
Debt 17,951 10,706 12,351 20,188 11,555 11,836
- Asset-backed financing 6,820 683 6,149 8,344 932 7,479
- Other debt 11,131 10,023 6,202 11,844 10,623 4,357
Other financial liabilities 188 153 35 105 98 7
Trade payables 14,725 14,751 361 12,603 12,637 260
Other payables: (*) 6,120 5,990 153 5,120 5,064 89
- Current tax payables 631 571 62 311 266 56
- Others 5,489 5,419 91 4,809 4,798 33
Deferred tax liabilities 193 193 - 263 262 1
Accrued expenses and deferred income 1,083 1,006 77 1,169 1,105 64
Liabilities held for sale 35 35 - 309 309 -
TOTAL STOCKHOLDERS’ EQUITY AND LIABILITIES 60,136 52,482 15,656 58,404 49,537 14,792
Total Liabilities adjusted for asset-backed financing transactions 53,316 51,799 9,507 50,060 48,605 7,313
(*) The balances for Total assets, Inventories and Other payables at December 31, 2006 differ from those previously published as the result of the reclassification of 101 million euros described in the
Notes to the Consolidated Financial Statements (in the paragraph Other information).