Chrysler 2007 Annual Report Download - page 50
Download and view the complete annual report
Please find page 50 of the 2007 Chrysler annual report below. You can navigate through the pages in the report by either clicking on the pages listed below, or by using the keyword search tool below to find specific information within the annual report.-
 1
1 -
2
-
3
-
4
-
5
-
6
-
7
-
8
-
9
-
10
-
11
-
12
-
13
-
14
-
15
-
16
-
17
-
18
-
19
-
20
-
21
-
22
-
23
-
24
-
25
-
26
-
27
-
28
-
29
-
30
-
31
-
32
-
33
-
34
-
35
-
36
-
37
-
38
-
39
-
 40
40 -
 41
41 -
 42
42 -
 43
43 -
 44
44 -
 45
45 -
 46
46 -
 47
47 -
 48
48 -
 49
49 -
 50
50 -
 51
51 -
 52
52 -
 53
53 -
 54
54 -
 55
55 -
 56
56 -
 57
57 -
 58
58 -
 59
59 -
 60
60 -
61
-
62
-
63
-
64
-
65
-
66
-
67
-
68
-
69
-
70
-
71
-
72
-
73
-
74
-
75
-
76
-
77
-
78
-
79
-
80
-
81
-
82
-
83
-
84
-
85
-
86
-
87
-
88
-
89
-
90
-
91
-
92
-
93
-
94
-
95
-
96
-
97
-
98
-
99
-
100
-
101
-
102
-
103
-
104
-
105
-
106
-
107
-
108
-
109
-
110
-
111
-
112
-
113
-
114
-
115
-
116
-
117
-
118
-
119
-
120
-
121
-
122
-
123
-
124
-
125
-
126
-
127
-
128
-
129
-
130
-
131
-
132
-
133
-
134
-
135
-
136
-
137
-
138
-
139
-
140
-
141
-
142
-
143
-
144
-
145
-
146
-
147
-
148
-
149
-
150
-
151
-
152
-
153
-
154
-
155
-
156
-
157
-
158
-
159
-
160
-
161
-
162
-
163
-
164
-
165
-
166
-
167
-
168
-
169
-
170
-
171
-
172
-
173
-
174
-
175
-
176
-
177
-
178
-
179
-
180
-
181
-
182
-
183
-
184
-
185
-
186
-
187
-
188
-
189
-
190
-
191
-
192
-
193
-
194
-
195
-
196
-
197
-
198
-
199
-
200
-
201
-
202
-
203
-
204
-
205
-
206
-
207
-
208
-
209
-
210
-
211
-
212
-
213
-
214
-
215
-
216
-
217
-
218
-
219
-
220
-
221
-
222
-
223
-
224
-
225
-
226
-
227
-
228
-
229
-
230
-
231
-
232
-
233
-
234
-
235
-
236
-
237
-
238
-
239
-
240
-
241
-
242
-
243
-
244
-
245
-
246
-
247
-
248
-
249
-
250
-
251
-
252
-
253
-
254
-
255
-
256
-
257
-
258
-
259
-
260
-
261
-
262
-
263
-
264
-
265
-
266
-
267
-
268
-
269
-
270
-
271
-
272
-
273
-
274
-
275
-
276
-
277
-
278
-
279
-
280
-
281
-
282
-
283
-
284
-
285
-
286
-
287
-
288
-
289
-
290
-
291
-
292
-
293
-
294
-
295
-
296
-
297
-
298
-
299
-
300
-
301
-
302
-
303
-
304
-
305
-
306
-
307
-
308
-
309
-
310
-
311
-
312
-
313
-
314
-
315
-
316
-
317
-
318
-
319
-
320
-
321
-
322
-
323
-
324
-
325
-
326
-
327
-
328
-
329
-
330
-
331
-
332
-
333
-
334
-
335
-
336
-
337
-
338
-
339
-
340
-
341
 |
 |

Report on Operations Financial Review of the Group 49
Debt under Industrial Activities partly includes funds raised by
the central cash management and transferred to financial
services companies in support of their activity (represented
under the item Intersegment financial receivables).
Intersegment financial receivables under Financial Services
represent loans or advances to industrial companies, relating
to the sale of receivables by industrial to financial services
companies in transactions that do not comply with the
requirements set out in IAS 39 for the recognition of those
sales, as well as any temporary cash deposited with the central
cash management.
At December 31, 2007, Cash and cash equivalents include 530
million euros (627 million euros at December 31, 2006) mainly
relating to Financial Services companies, allocated to service
the debt for securitisation structures and classified as Asset-
backed financing.
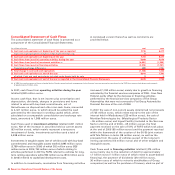
At December 31, 2007 net debt of the Financial Services
companies showed an increase of 715 million euros compared
to net debt at December 31, 2006, mainly due to growth in the
portfolio of CNH - Case New Holland totalling approximately
1.1 billion euros and investments for the period (mainly in
vehicles leased out under operating leases), totalling 319
million euros, offset only in part by the positive effects of
operating performance (approximately 290 million euros) and
the foreign currency translation effects (approximately 470
million euros).
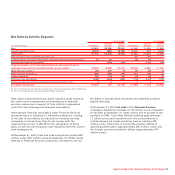
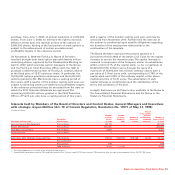
Net Debt by Activity Segment
At 12.31.2007 At 12.31.2006
Industrial Financial Industrial Financial
(in millions of euros) Consolidated Activities Services Consolidated Activities Services
Debt (17,951) (10,706) (12,351) (20,188) (11,555) (11,836)
- Asset-backed financing (6,820) (683) (6,149) (8,344) (932) (7,479)
- Other debt (11,131) (10,023) (6,202) (11,844) (10,623) (4,357)
Debt included among Liabilities held for sale ---(33) (33) -
Current financial receivables from jointly controlled financial services entities (a) 81 81 - 143 143 -
Intersegment financial receivables - 4,762 344 - 2,559 644
Financial payables net of intersegment balances and current financial
receivables from jointly controlled financial services entities (17,870) (5,863) (12,007) (20,078) (8,886) (11,192)
Other financial assets (b) 703 687 16 382 366 16
Other financial liabilities (b) (188) (153) (35) (105) (98) (7)
Current securities 291 136 155 224 134 90
Cash and cash equivalents 6,639 5,546 1,093 7,736 6,706 1,030
Cash and cash equivalents included among Assets held for sale 22-55 -
Net (debt)/cash position (10,423) 355 (10,778) (11,836) (1,773) (10,063)
(a) This item includes current financial receivables due to Fiat Group companies by the FAFS Group.
(b) This item includes the fair values of derivative financial instruments.