Chrysler 2007 Annual Report Download - page 78
Download and view the complete annual report
Please find page 78 of the 2007 Chrysler annual report below. You can navigate through the pages in the report by either clicking on the pages listed below, or by using the keyword search tool below to find specific information within the annual report.-
 1
1 -
2
-
3
-
4
-
5
-
6
-
7
-
8
-
9
-
10
-
11
-
12
-
13
-
14
-
15
-
16
-
17
-
18
-
19
-
20
-
21
-
22
-
23
-
24
-
25
-
26
-
27
-
28
-
29
-
30
-
31
-
32
-
33
-
34
-
35
-
36
-
37
-
38
-
39
-
40
-
41
-
42
-
43
-
44
-
45
-
46
-
47
-
48
-
49
-
50
-
51
-
52
-
53
-
54
-
55
-
56
-
57
-
58
-
59
-
60
-
61
-
62
-
63
-
64
-
65
-
66
-
67
-
 68
68 -
 69
69 -
 70
70 -
 71
71 -
 72
72 -
 73
73 -
 74
74 -
 75
75 -
 76
76 -
 77
77 -
 78
78 -
 79
79 -
 80
80 -
 81
81 -
 82
82 -
 83
83 -
 84
84 -
 85
85 -
 86
86 -
 87
87 -
 88
88 -
89
-
90
-
91
-
92
-
93
-
94
-
95
-
96
-
97
-
98
-
99
-
100
-
101
-
102
-
103
-
104
-
105
-
106
-
107
-
108
-
109
-
110
-
111
-
112
-
113
-
114
-
115
-
116
-
117
-
118
-
119
-
120
-
121
-
122
-
123
-
124
-
125
-
126
-
127
-
128
-
129
-
130
-
131
-
132
-
133
-
134
-
135
-
136
-
137
-
138
-
139
-
140
-
141
-
142
-
143
-
144
-
145
-
146
-
147
-
148
-
149
-
150
-
151
-
152
-
153
-
154
-
155
-
156
-
157
-
158
-
159
-
160
-
161
-
162
-
163
-
164
-
165
-
166
-
167
-
168
-
169
-
170
-
171
-
172
-
173
-
174
-
175
-
176
-
177
-
178
-
179
-
180
-
181
-
182
-
183
-
184
-
185
-
186
-
187
-
188
-
189
-
190
-
191
-
192
-
193
-
194
-
195
-
196
-
197
-
198
-
199
-
200
-
201
-
202
-
203
-
204
-
205
-
206
-
207
-
208
-
209
-
210
-
211
-
212
-
213
-
214
-
215
-
216
-
217
-
218
-
219
-
220
-
221
-
222
-
223
-
224
-
225
-
226
-
227
-
228
-
229
-
230
-
231
-
232
-
233
-
234
-
235
-
236
-
237
-
238
-
239
-
240
-
241
-
242
-
243
-
244
-
245
-
246
-
247
-
248
-
249
-
250
-
251
-
252
-
253
-
254
-
255
-
256
-
257
-
258
-
259
-
260
-
261
-
262
-
263
-
264
-
265
-
266
-
267
-
268
-
269
-
270
-
271
-
272
-
273
-
274
-
275
-
276
-
277
-
278
-
279
-
280
-
281
-
282
-
283
-
284
-
285
-
286
-
287
-
288
-
289
-
290
-
291
-
292
-
293
-
294
-
295
-
296
-
297
-
298
-
299
-
300
-
301
-
302
-
303
-
304
-
305
-
306
-
307
-
308
-
309
-
310
-
311
-
312
-
313
-
314
-
315
-
316
-
317
-
318
-
319
-
320
-
321
-
322
-
323
-
324
-
325
-
326
-
327
-
328
-
329
-
330
-
331
-
332
-
333
-
334
-
335
-
336
-
337
-
338
-
339
-
340
-
341
 |
 |

Report on Operations Iveco 77
In Eastern Europe, the market share of Iveco (GVW >_ 2.8 tons)
in 2007 reached 13% (11.8% in 2006), with improvements in all
three segments.
The market share of Iveco Irisbus in Western Europe, 19.9% in
2007, decreased by 0.7 percentage points from 2006. In
particular, its penetration rose in Great Britain (+1.2 percentage
points), Italy (+0.4 percentage points), and Spain (+0.1
percentage points), while it shrank in Germany and France (-1.5
percentage points on both markets).
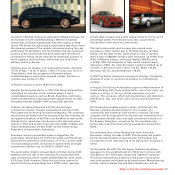
In 2007 Iveco delivered a total of 211,700 vehicles, of which
13,300 with buy-back commitments, achieving a 16.6% increase
from the previous year. Deliveries benefited both from the
success of the Daily light vehicle range and the new Stralis
heavy vehicle range. In Western Europe alone, with 147,500
vehicles delivered, sales rose by 9.1%. At the individual
country level, particularly strong performance was reported in
France (+12.9%), Germany (+12.4%), and Italy (+7.9%),
reflecting higher deliveries of light and heavy vehicles. The
increase in Spain (+2.9%) was achieved in the medium and
heavy segments, while sales were down in Great Britain, partly
on account of the soft market. Outside Western Europe, sales
volumes were up sharply in Eastern Europe (+58%) and Latin
America (+45%).
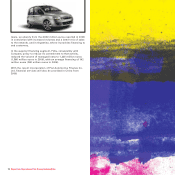
In the bus segment, Iveco delivered a total of 10,000 units,
realising a 5.3% improvement from 2006.
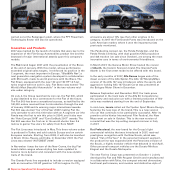
In China, Naveco, the 50-50 joint-venture with the NAC Group
(Nanjing Automotive Corporation), sold 24,100 light vehicles
(about +20% from 2006) and about 35,200 medium vehicles of
the Yuejin range (the range sold by Naveco expanded to Yuejin
vehicles following acquisition of Yuejin Motor Company in
2006). SAIC Iveco Hongyan Commercial Vehicles Co. Ltd, a
company jointly owned by Iveco on the basis of the
agreements reached in 2006 with SAIC Motor Corporation Ltd
and Chongqing Heavy Vehicle Group Co. Ltd, sold about 24,000
heavy vehicles in 2007.
In 2007, Iveco stepped up its strategy of alliances to reinforce
its presence on international markets.
On February 14, 2007 Iveco and Tata Motors announced the
signing of a memorandum of understanding to analyse the
feasibility of cooperation in the engineering, manufacturing,
sourcing and distribution of products, aggregates, and
components.
In June, Iveco and the Samotlor-NN industrial group, one of
the biggest body makers in Russia, signed an industrial
agreement that precedes the setting up of a joint-venture
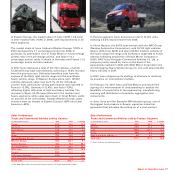
Sales Performance
T
rucks and Commercial Vehicles sold by Country
(in thousands of units) 2007 2006 % change
France 29.3 25.9 12.9
Germany 22.8 20.3 12.4
Great Britain 14.3 15.0 -4.6
Italy 38.8 36.0 7.9
Spain 21.2 20.6 2.9
Rest of Western Europe 21.1 17.3 21.3
Western Europe 147.5 135.1 9.1
Eastern Europe 31.2 19.7 58.1
Rest of the World 33.0 26.7 24.1
Total sales 211.7 181.5 16.6
Naveco 59.3 20.0 n.s.
SAIC Iveco Hongyan 24.0 - n.s.
Other associated companies (*) - 5.2 n.s.
Grand total 295.0 206.7 n.s.
(*) The 2006 figure refers to the licensee Otoyol (Turkey), no longer operational in 2007.
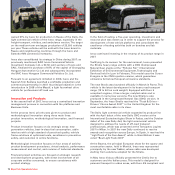
Sales Performance
Trucks and Commercial Vehicles sold by Product Segment
(in thousands of units) 2007 2006 % change
Heavy 60.2 45.2 33.1
Medium 20.5 21.2 -3.3
Light 115.5 101.1 14.3
Buses 10.0 9.5 5.3
Special purpose vehicles (*) 5.5 4.5 21.5
Total sales 211.7 181.5 16.6
(*) Astra, Defence, Fire-fighting vehicles.