Chrysler 2007 Annual Report Download - page 67
Download and view the complete annual report
Please find page 67 of the 2007 Chrysler annual report below. You can navigate through the pages in the report by either clicking on the pages listed below, or by using the keyword search tool below to find specific information within the annual report.-
 1
1 -
2
-
3
-
4
-
5
-
6
-
7
-
8
-
9
-
10
-
11
-
12
-
13
-
14
-
15
-
16
-
17
-
18
-
19
-
20
-
21
-
22
-
23
-
24
-
25
-
26
-
27
-
28
-
29
-
30
-
31
-
32
-
33
-
34
-
35
-
36
-
37
-
38
-
39
-
40
-
41
-
42
-
43
-
44
-
45
-
46
-
47
-
48
-
49
-
50
-
51
-
52
-
53
-
54
-
55
-
56
-
 57
57 -
 58
58 -
 59
59 -
 60
60 -
 61
61 -
 62
62 -
 63
63 -
 64
64 -
 65
65 -
 66
66 -
 67
67 -
 68
68 -
 69
69 -
 70
70 -
 71
71 -
 72
72 -
 73
73 -
 74
74 -
 75
75 -
 76
76 -
 77
77 -
78
-
79
-
80
-
81
-
82
-
83
-
84
-
85
-
86
-
87
-
88
-
89
-
90
-
91
-
92
-
93
-
94
-
95
-
96
-
97
-
98
-
99
-
100
-
101
-
102
-
103
-
104
-
105
-
106
-
107
-
108
-
109
-
110
-
111
-
112
-
113
-
114
-
115
-
116
-
117
-
118
-
119
-
120
-
121
-
122
-
123
-
124
-
125
-
126
-
127
-
128
-
129
-
130
-
131
-
132
-
133
-
134
-
135
-
136
-
137
-
138
-
139
-
140
-
141
-
142
-
143
-
144
-
145
-
146
-
147
-
148
-
149
-
150
-
151
-
152
-
153
-
154
-
155
-
156
-
157
-
158
-
159
-
160
-
161
-
162
-
163
-
164
-
165
-
166
-
167
-
168
-
169
-
170
-
171
-
172
-
173
-
174
-
175
-
176
-
177
-
178
-
179
-
180
-
181
-
182
-
183
-
184
-
185
-
186
-
187
-
188
-
189
-
190
-
191
-
192
-
193
-
194
-
195
-
196
-
197
-
198
-
199
-
200
-
201
-
202
-
203
-
204
-
205
-
206
-
207
-
208
-
209
-
210
-
211
-
212
-
213
-
214
-
215
-
216
-
217
-
218
-
219
-
220
-
221
-
222
-
223
-
224
-
225
-
226
-
227
-
228
-
229
-
230
-
231
-
232
-
233
-
234
-
235
-
236
-
237
-
238
-
239
-
240
-
241
-
242
-
243
-
244
-
245
-
246
-
247
-
248
-
249
-
250
-
251
-
252
-
253
-
254
-
255
-
256
-
257
-
258
-
259
-
260
-
261
-
262
-
263
-
264
-
265
-
266
-
267
-
268
-
269
-
270
-
271
-
272
-
273
-
274
-
275
-
276
-
277
-
278
-
279
-
280
-
281
-
282
-
283
-
284
-
285
-
286
-
287
-
288
-
289
-
290
-
291
-
292
-
293
-
294
-
295
-
296
-
297
-
298
-
299
-
300
-
301
-
302
-
303
-
304
-
305
-
306
-
307
-
308
-
309
-
310
-
311
-
312
-
313
-
314
-
315
-
316
-
317
-
318
-
319
-
320
-
321
-
322
-
323
-
324
-
325
-
326
-
327
-
328
-
329
-
330
-
331
-
332
-
333
-
334
-
335
-
336
-
337
-
338
-
339
-
340
-
341
 |
 |
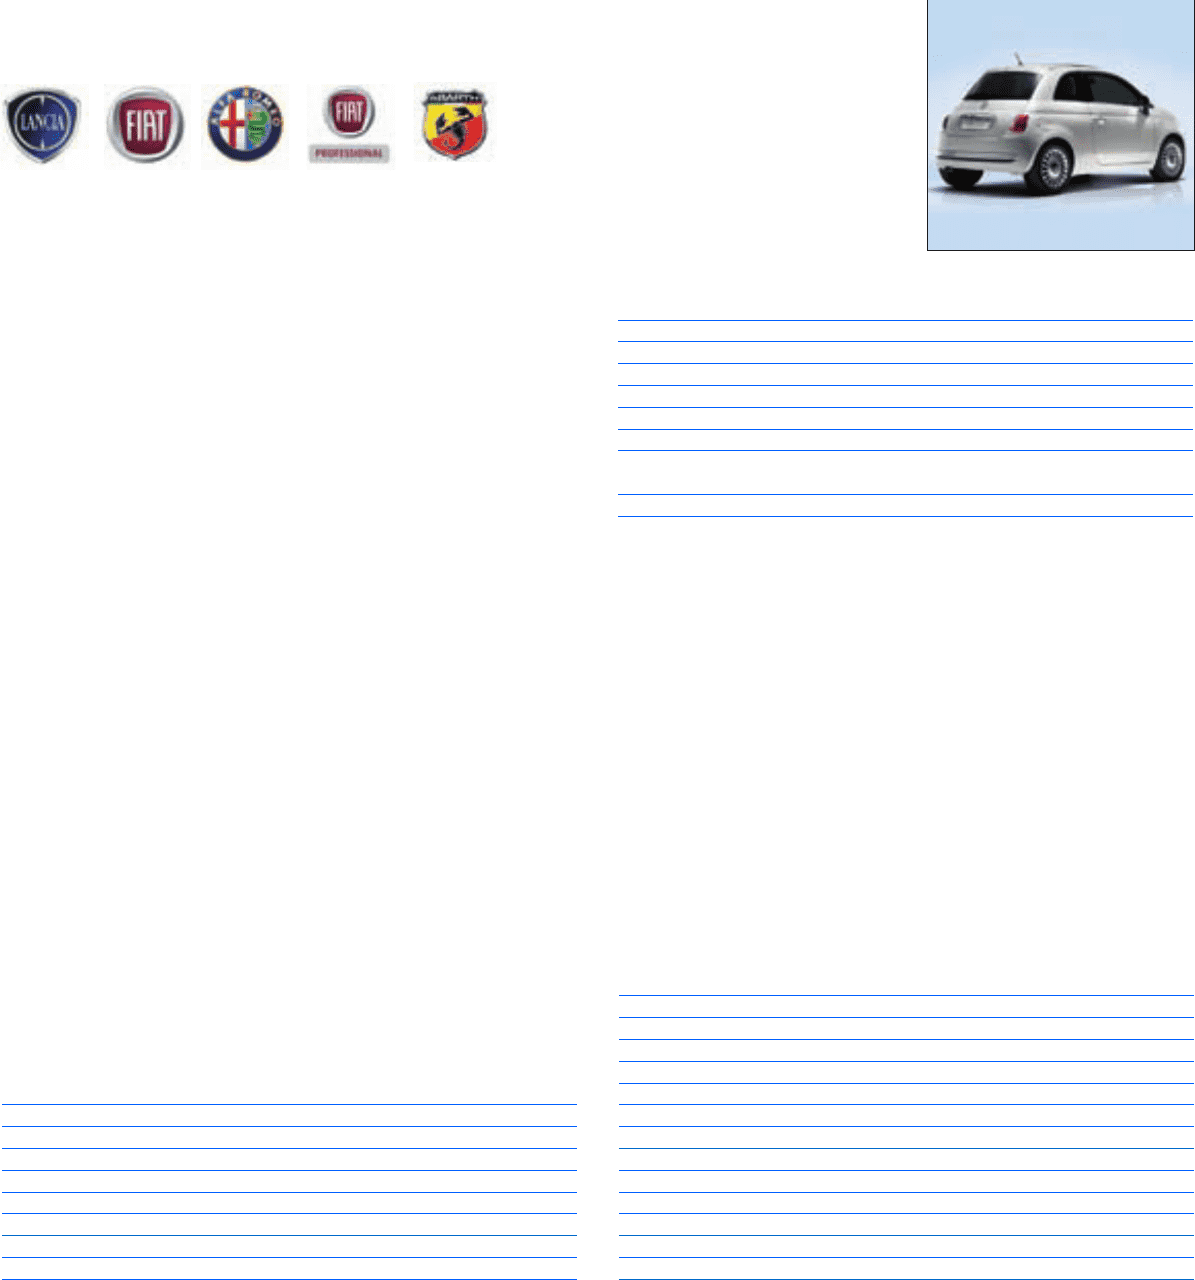
Fiat Group Automobiles — Fiat, Abarth,
Alfa Romeo, Lancia and Fiat Professional
Report on Operations Fiat Group Automobiles66
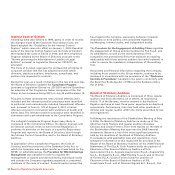
Operating Performance
In 2007, the Western European automobile market remained
stable overall at its 2006 levels.
The top-performing countries were Italy (+7.1%), where the
market was sustained in part by government incentives for car
park renewal, France (+3.2%), and Great Britain (+2.5%), while
demand fell in Spain (-1.2%). Demand fell even more sharply in
Germany (-9.2%), as it remained impacted by accelerated
purchasing of automobiles in the closing months of 2006, in
anticipation of the increase in German VAT rates from the
beginning of 2007.
Outside Western Europe, the markets served by this Sector
expanded at extremely fast rates: demand for cars in Poland rose
by 22.9%, while car registrations in Brazil accelerated significantly,
and increased by 26.4% compared with the previous year.
The light commercial vehicle market in Western Europe
expanded by 6.6% from 2006: demand rose by 8.1% in Italy
and Germany, by 6.8% in Great Britain, and by 5.5% in France,
while it remained virtually flat in Spain (-0.2%).
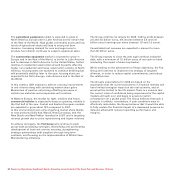
The Sector performed very well in 2007 in terms of market
share. In Italy, its share of the automobile market rose to
31.3%, up 0.6 percentage points from 2006. In Western Europe,
its 8% market share was up 0.5 percentage points from the
previous year.
Fiat Group Automobiles had a 42.1% share of the Italian light
commercial vehicle market, down by 3.1 percentage points
from 2006, due to the finalisation of significant quadrennial
fleet contracts in 2006. In Western Europe, its 11.7% share was
up by 0.7 percentage points.
In Brazil, the Sector’s share of the automobile and light
commercial vehicle markets was 25.9% (up 0.6 percentage
points) and 26.2% (+ 0.1 percentage points), respectively, in
2007. In Poland, its share of the automobile and light
commercial vehicle markets was 10.1% (-0.2 percentage points)
and 19.6% (-0.8 percentage points from 2006), respectively, in
2007.
In 2007 Fiat Group Automobiles delivered a total of 2,233,800
units, an increase of 12.8% from 2006 and its highest level
since 2000.
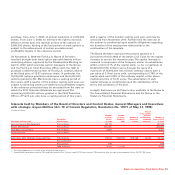
Highlights
(in millions of euros) 2007 2006
Net revenues 26,812 23,702
Trading profit 803 291
Operating result (*) 635 727
Investments in tangible and intangible assets (**) 1,865 2,163
- of which capitalised R&D costs 493 434
Total R&D expenses (***) 751 675
Automobiles and light commercial vehicles
delivered (number) 2,233,800 1,980,300
Employees at year-end (number) 50,542 44,691
(*) Including restructuring costs and unusual income (expenses).
(**) The 2006 figure included 750 million euros in leased assets. Starting from 2007 said activity
was conveyed to FAFS.
(***) Including R&D capitalised and charged to operations.
Automobile Market
(in thousands of units) 2007 2006 % change
France 2,064.5 2,000.5 3.2
Germany 3,148.2 3,468.0 -9.2
Great Britain 2,404.0 2,344.9 2.5
Italy 2,490.6 2,326.0 7.1
Spain 1,614.8 1,634.6 -1.2
Western Europe 14,794.2 14,765.7 0.2
Poland 293.3 238.7 22.9
Brazil 2,022.3 1,599.9 26.4
Sales Performance
Automobiles and Light Commercial Vehicles
(in thousands of units) 2007 2006 % change
France 94.7 88.0 7.6
Germany 107.3 110.1 -2.5
Great Britain 77.7 76.1 2.1
Italy 854.6 808.2 5.7
Spain 79.4 69.6 14.1
Rest of Western Europe 143.3 137.6 4.2
Western Europe 1,357.0 1,289.6 5.2
Poland 39.1 33.0 18.6
Brazil 613.1 464.8 31.9
Rest of the World 224.6 192.9 16.4
Total sales 2,233.8 1,980.3 12.8
Associated companies 79.1 89.9 -12.1
Grand total 2,312.9 2,070.2 11.7