Chrysler 2007 Annual Report Download - page 47
Download and view the complete annual report
Please find page 47 of the 2007 Chrysler annual report below. You can navigate through the pages in the report by either clicking on the pages listed below, or by using the keyword search tool below to find specific information within the annual report.-
 1
1 -
2
-
3
-
4
-
5
-
6
-
7
-
8
-
9
-
10
-
11
-
12
-
13
-
14
-
15
-
16
-
17
-
18
-
19
-
20
-
21
-
22
-
23
-
24
-
25
-
26
-
27
-
28
-
29
-
30
-
31
-
32
-
33
-
34
-
35
-
36
-
 37
37 -
 38
38 -
 39
39 -
 40
40 -
 41
41 -
 42
42 -
 43
43 -
 44
44 -
 45
45 -
 46
46 -
 47
47 -
 48
48 -
 49
49 -
 50
50 -
 51
51 -
 52
52 -
 53
53 -
 54
54 -
 55
55 -
 56
56 -
 57
57 -
58
-
59
-
60
-
61
-
62
-
63
-
64
-
65
-
66
-
67
-
68
-
69
-
70
-
71
-
72
-
73
-
74
-
75
-
76
-
77
-
78
-
79
-
80
-
81
-
82
-
83
-
84
-
85
-
86
-
87
-
88
-
89
-
90
-
91
-
92
-
93
-
94
-
95
-
96
-
97
-
98
-
99
-
100
-
101
-
102
-
103
-
104
-
105
-
106
-
107
-
108
-
109
-
110
-
111
-
112
-
113
-
114
-
115
-
116
-
117
-
118
-
119
-
120
-
121
-
122
-
123
-
124
-
125
-
126
-
127
-
128
-
129
-
130
-
131
-
132
-
133
-
134
-
135
-
136
-
137
-
138
-
139
-
140
-
141
-
142
-
143
-
144
-
145
-
146
-
147
-
148
-
149
-
150
-
151
-
152
-
153
-
154
-
155
-
156
-
157
-
158
-
159
-
160
-
161
-
162
-
163
-
164
-
165
-
166
-
167
-
168
-
169
-
170
-
171
-
172
-
173
-
174
-
175
-
176
-
177
-
178
-
179
-
180
-
181
-
182
-
183
-
184
-
185
-
186
-
187
-
188
-
189
-
190
-
191
-
192
-
193
-
194
-
195
-
196
-
197
-
198
-
199
-
200
-
201
-
202
-
203
-
204
-
205
-
206
-
207
-
208
-
209
-
210
-
211
-
212
-
213
-
214
-
215
-
216
-
217
-
218
-
219
-
220
-
221
-
222
-
223
-
224
-
225
-
226
-
227
-
228
-
229
-
230
-
231
-
232
-
233
-
234
-
235
-
236
-
237
-
238
-
239
-
240
-
241
-
242
-
243
-
244
-
245
-
246
-
247
-
248
-
249
-
250
-
251
-
252
-
253
-
254
-
255
-
256
-
257
-
258
-
259
-
260
-
261
-
262
-
263
-
264
-
265
-
266
-
267
-
268
-
269
-
270
-
271
-
272
-
273
-
274
-
275
-
276
-
277
-
278
-
279
-
280
-
281
-
282
-
283
-
284
-
285
-
286
-
287
-
288
-
289
-
290
-
291
-
292
-
293
-
294
-
295
-
296
-
297
-
298
-
299
-
300
-
301
-
302
-
303
-
304
-
305
-
306
-
307
-
308
-
309
-
310
-
311
-
312
-
313
-
314
-
315
-
316
-
317
-
318
-
319
-
320
-
321
-
322
-
323
-
324
-
325
-
326
-
327
-
328
-
329
-
330
-
331
-
332
-
333
-
334
-
335
-
336
-
337
-
338
-
339
-
340
-
341
 |
 |

Report on Operations Financial Review of the Group46
Industrial Activities
In 2007, Net revenues of Industrial Activities totalled 57,533
million euros, an increase of 14.4% from the previous year.
This improvement was driven by particularly positive
performance at the main industrial businesses. Revenues of
the Automobiles businesses grew by 15.4%, CNH - Case New
Holland revenues increased by 23.6% when stated in dollars;
Iveco recorded revenue growth of 24.1%. As for the
Components and Production Systems businesses, revenues
increased at FPT Powertrain Technologies and Magneti Marelli,
while they decreased at Teksid, mainly due to the sale of the
Magnesium operations which was partially compensated by the
consolidation of Teksid Aluminum. At Comau, revenues
decreased.
In 2007, Trading profit of Industrial Activities totalled 2,894
million euros, an increase of 1,239 million euros from the
1,655 million euros reported last year: all industrial businesses
contributed to this improvement, with the Automobiles
businesses, Iveco and CNH - Case New Holland delivering
particularly positive results.
In 2007 Industrial Activities had Operating income of 2,874
million euros, compared with 1,737 million euros in 2006. The
1,137 million euro increase mainly reflects higher trading
profit.
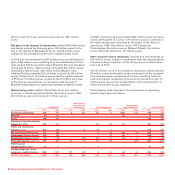
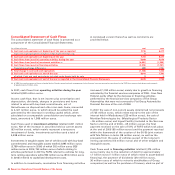
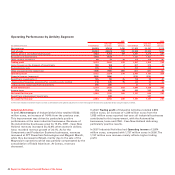
Operating Performance by Activity Segment
2007 2006
Industrial Financial Industrial Financial
(in millions of euros) Consolidated Activities Services Consolidated Activities Services
Net revenues 58,529 57,533 1,410 51,832 50,297 2,218
Cost of sales 48,924 48,428 910 43,888 42,934 1,637
Selling, general and administrative costs 4,924 4,747 177 4,697 4,416 281
Research and development 1,536 1,536 - 1,401 1,401 -
Other income (expenses) 88 72 16 105 109 (4)
Trading profit 3,233 2,894 339 1,951 1,655 296
Gains (losses) on the disposal of investments 190 188 2 607 575 32
Restructuring costs 105 104 1 450 448 2
Other unusual income (expenses) (166) (104) (62) (47) (45) (2)
Operating result 3,152 2,874 278 2,061 1,737 324
Financial income (expenses) (564) (564) - (576) (576) -
Result from investments (*) 185 110 75 156 95 61
- Net result of investees accounted for using the equity method 210 135 75 125 64 61
- Other income (expenses) from investments (25) (25) - 31 31 -
Result before taxes 2,773 2,420 353 1,641 1,256 385
Income taxes 719 635 84 490 392 98
Net result for the year 2,054 1,785 269 1,151 864 287
Result from intersegment investments - 269 - - 287 -
Net result for the year 2,054 2,054 269 1,151 1,151 287
(*) This item includes investment income as well as writedowns and upward adjustments in non-intersegment investments accounted for by using the equity method.