Chrysler 2007 Annual Report Download - page 77
Download and view the complete annual report
Please find page 77 of the 2007 Chrysler annual report below. You can navigate through the pages in the report by either clicking on the pages listed below, or by using the keyword search tool below to find specific information within the annual report.-
 1
1 -
2
-
3
-
4
-
5
-
6
-
7
-
8
-
9
-
10
-
11
-
12
-
13
-
14
-
15
-
16
-
17
-
18
-
19
-
20
-
21
-
22
-
23
-
24
-
25
-
26
-
27
-
28
-
29
-
30
-
31
-
32
-
33
-
34
-
35
-
36
-
37
-
38
-
39
-
40
-
41
-
42
-
43
-
44
-
45
-
46
-
47
-
48
-
49
-
50
-
51
-
52
-
53
-
54
-
55
-
56
-
57
-
58
-
59
-
60
-
61
-
62
-
63
-
64
-
65
-
66
-
 67
67 -
 68
68 -
 69
69 -
 70
70 -
 71
71 -
 72
72 -
 73
73 -
 74
74 -
 75
75 -
 76
76 -
 77
77 -
 78
78 -
 79
79 -
 80
80 -
 81
81 -
 82
82 -
 83
83 -
 84
84 -
 85
85 -
 86
86 -
 87
87 -
88
-
89
-
90
-
91
-
92
-
93
-
94
-
95
-
96
-
97
-
98
-
99
-
100
-
101
-
102
-
103
-
104
-
105
-
106
-
107
-
108
-
109
-
110
-
111
-
112
-
113
-
114
-
115
-
116
-
117
-
118
-
119
-
120
-
121
-
122
-
123
-
124
-
125
-
126
-
127
-
128
-
129
-
130
-
131
-
132
-
133
-
134
-
135
-
136
-
137
-
138
-
139
-
140
-
141
-
142
-
143
-
144
-
145
-
146
-
147
-
148
-
149
-
150
-
151
-
152
-
153
-
154
-
155
-
156
-
157
-
158
-
159
-
160
-
161
-
162
-
163
-
164
-
165
-
166
-
167
-
168
-
169
-
170
-
171
-
172
-
173
-
174
-
175
-
176
-
177
-
178
-
179
-
180
-
181
-
182
-
183
-
184
-
185
-
186
-
187
-
188
-
189
-
190
-
191
-
192
-
193
-
194
-
195
-
196
-
197
-
198
-
199
-
200
-
201
-
202
-
203
-
204
-
205
-
206
-
207
-
208
-
209
-
210
-
211
-
212
-
213
-
214
-
215
-
216
-
217
-
218
-
219
-
220
-
221
-
222
-
223
-
224
-
225
-
226
-
227
-
228
-
229
-
230
-
231
-
232
-
233
-
234
-
235
-
236
-
237
-
238
-
239
-
240
-
241
-
242
-
243
-
244
-
245
-
246
-
247
-
248
-
249
-
250
-
251
-
252
-
253
-
254
-
255
-
256
-
257
-
258
-
259
-
260
-
261
-
262
-
263
-
264
-
265
-
266
-
267
-
268
-
269
-
270
-
271
-
272
-
273
-
274
-
275
-
276
-
277
-
278
-
279
-
280
-
281
-
282
-
283
-
284
-
285
-
286
-
287
-
288
-
289
-
290
-
291
-
292
-
293
-
294
-
295
-
296
-
297
-
298
-
299
-
300
-
301
-
302
-
303
-
304
-
305
-
306
-
307
-
308
-
309
-
310
-
311
-
312
-
313
-
314
-
315
-
316
-
317
-
318
-
319
-
320
-
321
-
322
-
323
-
324
-
325
-
326
-
327
-
328
-
329
-
330
-
331
-
332
-
333
-
334
-
335
-
336
-
337
-
338
-
339
-
340
-
341
 |
 |

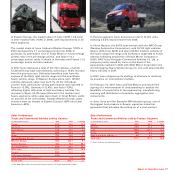
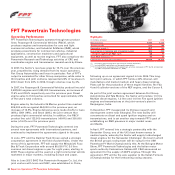
Operating Performance
In 2007 demand for commercial vehicles in Western Europe
(with gross vehicle weight “GVW” >_ 2.8 tons) rose 10.9% from
2006, to 1,259,000 units. Among the principal markets, the best
performance was posted by Spain (+17%), France (+12.2%),
Germany (+12.5%), and Italy (+11.7%), while growth was more
limited in Great Britain (+3.6%).
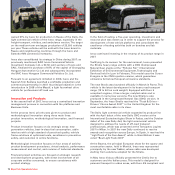
The light vehicle segment (GVW of between 2.8 and 6 tons)
expanded by 15.4% from 2006, mainly due to growth in
demand for car-derived vehicles. Major increases were
reported in Spain (+20.6%), France (+17%), Italy (+16.1%),
Germany (+16.5%), and Great Britain (+10.3%).
Demand for medium vehicles (GVW of between 6.1 and 15.9
tons) contracted (-5.3%) from 2006, which was characterized by
a particularly high rate of vehicle registrations in view of
introduction of the digital tachograph and the new emissions
regulations applicable to these vehicles. The English (-16.1%)
and French (-17.1%) markets reported the sharpest declines; the
Italian and German markets remained fairly stable, while
demand grew at a brisk pace in Spain (+10.2%).
The heavy segment (GVW >_ 16 tons), which expanded by a
modest 2.3%, was also impacted by the high rates of vehicle
registrations in the previous year that were connected with
regulatory changes. In particular, strong growth in Germany
(+8.9%) and Spain (+9.8%) contrasted with a downturn in UK
(-14.9%); growth was modest on the Italian and French
markets.
Demand for commercial vehicles in Eastern Europe (GVW >_ 2.8
tons) was 159,200 units in 2007, up 39.5% from the previous
year. The most significant increase was posted in the heavy
segment (+56.6% from 2006).
Report on Operations Iveco
The Western European bus market, totalling 36,200 units, grew
by 4.7% from 2006, in the face of major growth in the Minibus
and Truck Derived segment, against lower demand in the
Intercity and Coach segment and stability in the City segment.
On a country-by-country basis, healthy performances were
reported in France (+5.4%), Spain (+8.6%), and Great Britain
(+19.4%) while demand declined in Italy (-9.4%) and Germany
(-4%).
The market share of Iveco in Western Europe (GVW >_ 2.8 tons)
was 10.3% (-0.3 percentage points lower than in 2006). Its
share of the light vehicle segment, 8.7% (-0.4 percentage
points), was penalized by competition from car-derived
vehicles (vans). In the medium segment, Iveco’s share rose by
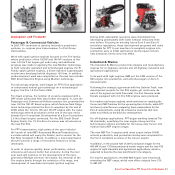
0.7 percentage points to 26.2%. The new Stralis, which was
launched in March 2007, contributed to the strengthening of
Iveco’s market share in the heavy segment, which reached
11.4% for a rise of 0.5 percentage points from the previous
year.
Trucks and
Commercial Vehicles — Iveco
76
Highlights
(in millions of euros) 2007 2006
Net revenues 11,196 9,136
Trading profit 813 546
Operating result (*) 803 565
Investments in tangible and intangible assets (**) 347 342
- of which capitalised R&D costs 78 88
Total R&D expenses (***) 207 174
Employees at year-end (number) (****) 26,461 24,533
(*) Including restructuring costs and unusual income (expenses).
(**) Net of vehicles sold with buy-back commitments.
(***) Including R&D capitalised and charged to operations.
(****) Excluding employees of the powertrain activities conveyed in FPT (8,218 units at December
31, 2007 and 8,256 units at December 31, 2006).
Trucks and Commercial Vehicles Market (GVW >_ 2.8 ton)
(in thousands of units) 2007 2006 % change
France 224.8 200.3 12.2
Germany 278.6 247.8 12.5
Great Britain 201.7 194.7 3.6
Italy 134.5 120.4 11.7
Spain 138.4 11 8 . 3 1 7. 0
Other Western European Countries 281.0 253.9 10.5
Western Europe 1,259.0 1,135.4 10.9
Trucks and Commercial Vehicles Market by product segment
(GVW >_ 2.8 ton)
(in thousands of units) 2007 2006 % change
Heavy 267.1 261.1 2.3
Medium 76.5 80.7 -5.3
Light 915.4 793.6 15.4
Western Europe 1,259.0 1,135.4 10.9