CarMax 2006 Annual Report Download - page 57
Download and view the complete annual report
Please find page 57 of the 2006 CarMax annual report below. You can navigate through the pages in the report by either clicking on the pages listed below, or by using the keyword search tool below to find specific information within the annual report.-
 1
1 -
2
-
3
-
4
-
5
-
6
-
7
-
8
-
9
-
10
-
11
-
12
-
13
-
14
-
15
-
16
-
17
-
18
-
19
-
20
-
21
-
22
-
23
-
24
-
25
-
26
-
27
-
28
-
29
-
30
-
31
-
32
-
33
-
34
-
35
-
36
-
37
-
38
-
39
-
40
-
41
-
42
-
43
-
44
-
45
-
46
-
 47
47 -
 48
48 -
 49
49 -
 50
50 -
 51
51 -
 52
52 -
 53
53 -
 54
54 -
 55
55 -
 56
56 -
 57
57 -
 58
58 -
 59
59 -
 60
60 -
 61
61 -
 62
62 -
 63
63 -
 64
64
 |
 |

CARMAX 2006
55
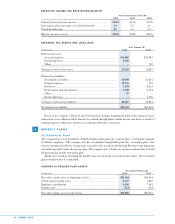
As part of its customer service strategy, the company guarantees the used vehicles it retails with a 30-day
limited warranty. A vehicle in need of repair within 30 days of the customer’s purchase will be repaired free of
charge. As a result, each vehicle sold has an implied liability associated with it. Accordingly, the company
records a provision for estimated repairs during the guarantee period for each vehicle sold based on historical
trends. The liability for this guarantee was $1.9 million at February 28, 2006 and February 28, 2005, and is
included in accrued expenses and other current liabilities in the consolidated balance sheets.
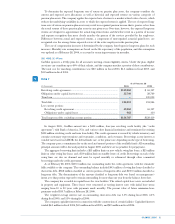
RECENT ACCOUNTING PRONOUNCEMENTS
In December 2004, the FASB issued SFAS No. 123 (Revised 2004), “Share-Based Payment,” that will
require the company to expense costs related to stock-based compensation, including employee stock
options. With limited exceptions, SFAS No. 123(R) requires that the fair value of share-based payments to
employees be expensed over the period service is received. Pro forma disclosure is no longer an alternative.
Effective March 1, 2006, the company adopted SFAS No. 123(R), applying the modified retrospective
method whereby prior period financial statements will be restated based on the amounts previously reported
in the pro forma footnote disclosures required by SFAS No. 123.
SFAS No. 123(R) allows the use of either closed form (e.g., Black-Scholes) models or open form (e.g.,
lattice or binomial) models to measure the fair value of the share-based payment as long as that model is
capable of incorporating all of the substantive characteristics unique to stock-based awards. In accordance
with the transition provisions of SFAS No. 123(R), the expense attributable to a stock-based award will be
measured in accordance with the company’s measurement model at that award’s date of grant. The
company intends to use a lattice model to value stock-based awards granted during fiscal 2007.
The company believes the pro forma disclosures in Note 2(P), “Stock-Based Compensation,” have
provided an appropriate short-term indicator of the level of expense that will be recognized in accordance
with SFAS No. 123(R). However, the total expense recorded in future periods will depend on several
variables, including the type of stock-based awards granted, the number of stock-based awards that vest, the
fair value of those vested awards, the retirement eligibility date of associates receiving awards, and the model
used to measure the fair value.
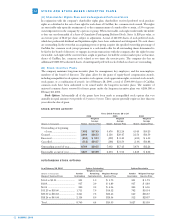
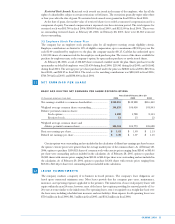
SELECTED QUARTERLY FINANCIAL DATA (UNAUDITED)
(In thousands except First Quarter Second Quarter Third Quarter Fourth Quarter Fiscal Year
per share data) 2006 2005 2006 2005 2006 2005 2006 2005 2006 2005
Net sales and
operating revenues. . . . $1,578,360 $1,324,990 $1,633,853 $1,323,507 $1,423,980 $1,215,711 $1,623,774 $1,396,054 $6,259,967 $5,260,262
Gross profit . . . . . . . . . . . . $ 197,759 $ 167,230 $ 208,584 $ 163,200 $ 177,173 $ 145,446 $ 207,198 $ 174,320 $ 790,714 $ 650,196
CarMax Auto
Finance income. . . . . . . $ 27,071 $ 21,816 $ 23,824 $ 20,744 $ 27,971 $ 20,439 $ 25,461 $ 19,657 $ 104,327 $ 82,656
Selling, general, and
administrative
expenses . . . . . . . . . . . . . $ 159,235 $ 130,688 $ 165,274 $ 134,726 $ 161,727 $ 137,170 $ 165,752 $ 143,993 $ 651,988 $ 546,577
(Loss) gain on franchise
dispositions. . . . . . . . . . . $—$—$—$ (11) $—$ 692 $—$ (48
)
$—$ 633
Net earnings . . . . . . . . . . . $ 39,818 $ 35,330 $ 41,422 $ 29,859 $ 26,412 $ 18,045 $ 40,403 $ 29,694 $ 148,055 $ 112,928
Net earnings per share:
Basic. . . . . . . . . . . . . . . . . $ 0.38 $ 0.34 $ 0.40 $ 0.29 $ 0.25 $ 0.17 $ 0.39 $ 0.28 $ 1.41 $ 1.09
Diluted . . . . . . . . . . . . . . $ 0.37 $ 0.33 $ 0.39 $ 0.28 $ 0.25 $ 0.17 $ 0.38 $ 0.28 $ 1.39 $ 1.07
15
16