CarMax 2006 Annual Report Download - page 27
Download and view the complete annual report
Please find page 27 of the 2006 CarMax annual report below. You can navigate through the pages in the report by either clicking on the pages listed below, or by using the keyword search tool below to find specific information within the annual report.-
 1
1 -
2
-
3
-
4
-
5
-
6
-
7
-
8
-
9
-
10
-
11
-
12
-
13
-
14
-
15
-
16
-
 17
17 -
 18
18 -
 19
19 -
 20
20 -
 21
21 -
 22
22 -
 23
23 -
 24
24 -
 25
25 -
 26
26 -
 27
27 -
 28
28 -
 29
29 -
 30
30 -
 31
31 -
 32
32 -
 33
33 -
 34
34 -
 35
35 -
 36
36 -
 37
37 -
38
-
39
-
40
-
41
-
42
-
43
-
44
-
45
-
46
-
47
-
48
-
49
-
50
-
51
-
52
-
53
-
54
-
55
-
56
-
57
-
58
-
59
-
60
-
61
-
62
-
63
-
64
 |
 |

CARMAX 2006
25
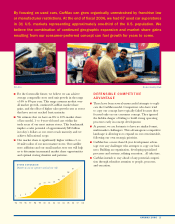
Impact of Inflation
Inflation has not been a significant contributor to results. Profitability is based on achieving targeted unit sales
and gross profit dollars per vehicle rather than on average retail prices.
Seasonality
Most of our superstores experience their strongest traffic and sales in the spring and summer fiscal quarters.
Sales are typically lowest in the fall quarter, which coincides with the new vehicle model-year-changeover
period. In the fall quarter, the new model year introductions and discounts on model year closeouts generally
can cause rapid depreciation in used car pricing, particularly for late-model used cars. Seasonal patterns for car
buying and selling may vary in different parts of the country and, as CarMax expands geographically, these
differences could have an effect on the overall seasonal pattern of the company’s results.
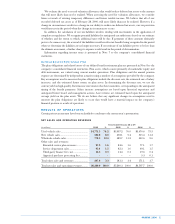
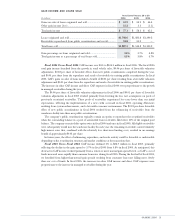
Supplemental Sales Information
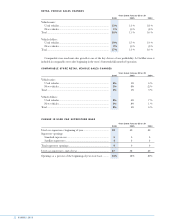
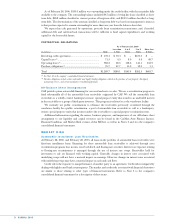
UNIT SALES
Years Ended February 28 or 29
2006 2005 2004
Used vehicles.................................................................. 289,888 253,168 224,099
New vehicles................................................................... 20,901 20,636 21,641
Wholesale vehicles......................................................... 179,548 155,393 127,168
AVERAGE SELLING PRICES
Years Ended February 28 or 29
2006 2005 2004
Used vehicles.................................................................. $16,298 $15,663 $15,379
New vehicles................................................................... $23,887 $23,671 $23,650
Wholesale vehicles......................................................... $ 4,233 $ 3,712 $ 3,383
RETAIL VEHICLE SALES MIX
Years Ended February 28 or 29
2006 2005 2004
Vehicle units:
Used vehicles............................................................... 93% 92% 91%
New vehicles ............................................................... 7%8%9%
Total................................................................................... 100% 100% 100%
Vehicle dollars:
Used vehicles............................................................... 90% 89% 87%
New vehicles................................................................ 10%11%13%
Total................................................................................... 100% 100% 100%