CarMax 2006 Annual Report Download - page 45
Download and view the complete annual report
Please find page 45 of the 2006 CarMax annual report below. You can navigate through the pages in the report by either clicking on the pages listed below, or by using the keyword search tool below to find specific information within the annual report.-
 1
1 -
2
-
3
-
4
-
5
-
6
-
7
-
8
-
9
-
10
-
11
-
12
-
13
-
14
-
15
-
16
-
17
-
18
-
19
-
20
-
21
-
22
-
23
-
24
-
25
-
26
-
27
-
28
-
29
-
30
-
31
-
32
-
33
-
34
-
 35
35 -
 36
36 -
 37
37 -
 38
38 -
 39
39 -
 40
40 -
 41
41 -
 42
42 -
 43
43 -
 44
44 -
 45
45 -
 46
46 -
 47
47 -
 48
48 -
 49
49 -
 50
50 -
 51
51 -
 52
52 -
 53
53 -
 54
54 -
 55
55 -
56
-
57
-
58
-
59
-
60
-
61
-
62
-
63
-
64
 |
 |

CARMAX 2006
43
The pro forma effect on fiscal 2006 and prior fiscal years may not be representative of the effect on net
earnings and net earnings per share for future years.
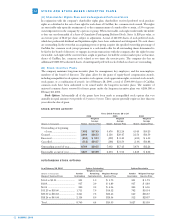
For the purpose of computing the pro forma amounts indicated above, the fair value of each option on the
date of grant was estimated using the Black-Scholes option-pricing model.
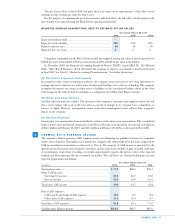
WEIGHTED AVERAGE ASSUMPTIONS USED TO ESTIMATE OPTION VALUES
Years Ended February 28 or 29
2006 2005 2004
Expected dividend yield .................................................................. ———
Expected stock volatility.................................................................. 52% 73% 78%
Risk-free interest rates...................................................................... 4% 3% 3%
Expected lives (in years) .................................................................. 555
Using these assumptions in the Black-Scholes model, the weighted average fair value of options granted was
$12.68 per share in fiscal 2006, $17.50 per share in fiscal 2005, and $9.14 per share in fiscal 2004.
In December 2004, the Financial Accounting Standards Board (“FASB”) issued SFAS No. 123 (Revised
2004), “Share-Based Payment,” which will require the company to expense costs related to share-based awards
in fiscal 2007. See Note 15, “Recent Accounting Pronouncements,” for further discussions.
(Q) Derivative Financial Instruments
In connection with certain securitization activities, the company enters into interest rate swap agreements to
manage exposure to interest rates and to more closely match funding costs to the use of funding. The company
recognizes the interest rate swaps as either assets or liabilities on the consolidated balance sheets at fair value
with changes in fair value included in earnings as a component of CarMax Auto Finance income.
(R) Risks and Uncertainties
CarMax sells used and new vehicles. The diversity of the company’s customers and suppliers reduces the risk
that a severe impact will occur in the near term as a result of changes in its customer base, competition, or
sources of supply. However, management cannot assure that unanticipated events will not have a negative
impact on the company.
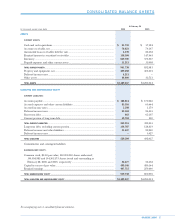
(S) Reclassifications
Certain prior year amounts have been reclassified to conform to the current year’s presentation. The consolidated
balance sheets and consolidated statements of cash flows reflect the reclassifications of restricted cash deposits
of $12.0 million at February 28, 2005, and $13.0 million at February 29, 2004, as discussed in Note 2(H).
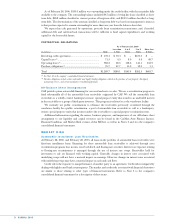
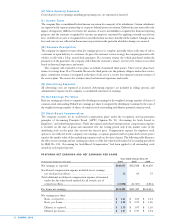
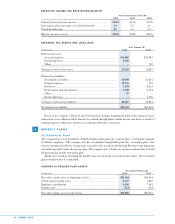
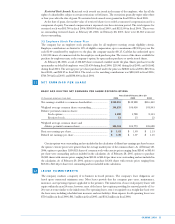
CARMAX AUTO FINANCE INCOME
The company’s finance operation, CAF, originates prime-rated financing for qualified customers at competitive
market rates of interest. Throughout each month, the company sells substantially all of the loans originated by
CAF in securitization transactions as discussed in Note 4. The majority of CAF income is generated by the
spread between the interest rates charged to customers and the related cost of funds. A gain, recorded at the time
of securitization, results from recording a receivable approximately equal to the present value of the expected
residual cash flows generated by the securitized receivables. The cash flows are calculated taking into account
expected prepayments and defaults.
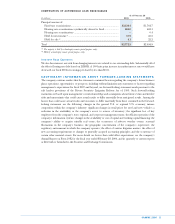
Years Ended February 28 or 29
(In millions) 2006 2005 2004
Total gain income ......................................................................... $ 77.1 $58.3 $65.1
Other CAF income:
Servicing fee income ............................................................... 27.6 24.7 21.8
Interest income........................................................................ 21.4 19.0 16.0
Total other CAF income .............................................................. 49.0 43.7 37.8
Direct CAF expenses:
CAF payroll and fringe benefit expense ................................ 10.3 9.0 8.2
Other direct CAF expenses .................................................... 11.5 10.3 9.7
Total direct CAF expenses ........................................................... 21.8 19.3 17.9
CarMax Auto Finance income .................................................... $104.3 $82.7 $85.0
3