CarMax 2006 Annual Report Download - page 24
Download and view the complete annual report
Please find page 24 of the 2006 CarMax annual report below. You can navigate through the pages in the report by either clicking on the pages listed below, or by using the keyword search tool below to find specific information within the annual report.-
 1
1 -
2
-
3
-
4
-
5
-
6
-
7
-
8
-
9
-
10
-
11
-
12
-
13
-
 14
14 -
 15
15 -
 16
16 -
 17
17 -
 18
18 -
 19
19 -
 20
20 -
 21
21 -
 22
22 -
 23
23 -
 24
24 -
 25
25 -
 26
26 -
 27
27 -
 28
28 -
 29
29 -
 30
30 -
 31
31 -
 32
32 -
 33
33 -
 34
34 -
35
-
36
-
37
-
38
-
39
-
40
-
41
-
42
-
43
-
44
-
45
-
46
-
47
-
48
-
49
-
50
-
51
-
52
-
53
-
54
-
55
-
56
-
57
-
58
-
59
-
60
-
61
-
62
-
63
-
64
 |
 |

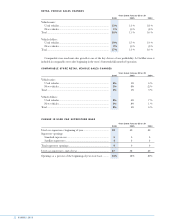
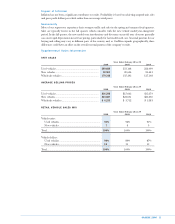
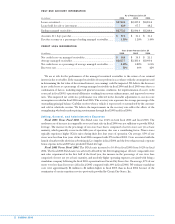
RETAIL VEHICLE SALES CHANGES
Years Ended February 28 or 29
2006 2005 2004
Vehicle units:
Used vehicles............................................................................. 15% 13 % 18 %
New vehicles.............................................................................. 1% (5)% (3)%
Total ................................................................................................ 14% 11 % 16 %
Vehicle dollars:
Used vehicles............................................................................. 19% 15 % 19 %
New vehicles.............................................................................. 2% (5)% (1)%
Total ................................................................................................ 17% 13 % 16 %
Comparable store used unit sales growth is one of the key drivers of our profitability. A CarMax store is
included in comparable store sales beginning in the store’s fourteenth full month of operation.
COMPARABLE STORE RETAIL VEHICLE SALES CHANGES
Years Ended February 28 or 29
2006 2005 2004
Vehicle units:
Used vehicles............................................................................. 4% 1% 6 %
New vehicles.............................................................................. 1% 8% (1)%
Total ................................................................................................ 4% 1% 5 %
Vehicle dollars:
Used vehicles............................................................................. 8% 3% 7 %
New vehicles.............................................................................. 1% 8% 1 %
Total ................................................................................................ 8% 3% 6 %
CHANGE IN USED CAR SUPERSTORE BASE
Years Ended February 28 or 29
2006 2005 2004
Used car superstores, beginning of year....................................... 58 49 40
Superstore openings:
Standard superstores................................................................. 555
Satellite superstores................................................................... 444
Total superstore openings .............................................................. 999
Used car superstores, end of year ................................................. 67 58 49
Openings as a percent of the beginning-of-year store base.......... 16% 18% 23%
22
CARMAX 2006