CarMax 2006 Annual Report Download - page 29
Download and view the complete annual report
Please find page 29 of the 2006 CarMax annual report below. You can navigate through the pages in the report by either clicking on the pages listed below, or by using the keyword search tool below to find specific information within the annual report.-
 1
1 -
2
-
3
-
4
-
5
-
6
-
7
-
8
-
9
-
10
-
11
-
12
-
13
-
14
-
15
-
16
-
17
-
18
-
 19
19 -
 20
20 -
 21
21 -
 22
22 -
 23
23 -
 24
24 -
 25
25 -
 26
26 -
 27
27 -
 28
28 -
 29
29 -
 30
30 -
 31
31 -
 32
32 -
 33
33 -
 34
34 -
 35
35 -
 36
36 -
 37
37 -
 38
38 -
 39
39 -
40
-
41
-
42
-
43
-
44
-
45
-
46
-
47
-
48
-
49
-
50
-
51
-
52
-
53
-
54
-
55
-
56
-
57
-
58
-
59
-
60
-
61
-
62
-
63
-
64
 |
 |

CARMAX 2006
27
Fiscal 2005 Versus Fiscal 2004. The increase in used vehicle gross profit dollars per unit in fiscal 2005
was primarily the result of changing and refining our in-store appraisal strategy. Under the revised strategy,
the acquisition cost of used vehicles sourced through our appraisal purchases decreased, resulting in higher
used vehicle gross profit.
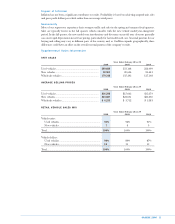
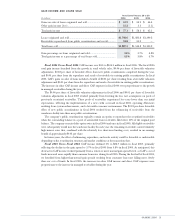
New Vehicle Gross Profit
Fiscal 2006 Versus Fiscal 2005. The increase in the new vehicle gross profit dollars per unit in fiscal 2006
was primarily attributable to the higher profits realized during the domestic new car manufacturers’ employee
pricing programs. We were able to modestly increase our new car prices during these programs, as our pricing
had generally been below the manufacturers’ specified employee discount prices.
Fiscal 2005 Versus Fiscal 2004. The decline in the new vehicle gross profit dollars per unit in fiscal 2005
reflected the heightened competitive market with strong manufacturers’ incentives, which required more
aggressive pricing in order to drive unit sales volume.
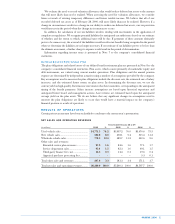
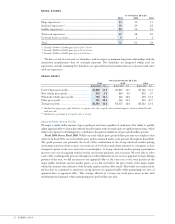
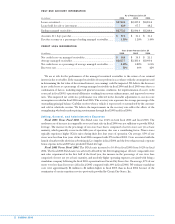
Wholesale Vehicle Gross Profit
Fiscal 2006 Versus Fiscal 2005. The wholesale vehicle gross profit dollars per unit increased substantially
in fiscal 2006, primarily as a result of the stronger-than-normal wholesale market pricing environment. The
refinements in our in-store appraisal strategy benefited our wholesale operations, while allowing us to maintain
used vehicle gross profit dollars per unit levels in the face of rising vehicle acquisition costs. While we did not
increase our appraisal offers at the same rate as the steep increase in the major public wholesale auction market
prices, our own wholesale auctions generally reflected the pricing trends of the public wholesale auctions.
Our wholesale gross profit growth was particularly strong in the second half of fiscal 2006. Wholesale pricing
typically declines during the fall due to pressure from model year closeout sales and from reduced demand at
auction as dealers pare back inventories heading into the slower-volume winter months. As a result, our third
quarter is typically when we experience our lowest wholesale prices and margins. In this quarter, we adjusted our
appraisal offers to incorporate the anticipated drop in wholesale pricing. We were particularly aggressive in our
appraisals of SUVs, where prices had fallen dramatically through the summer. Pricing in the overall wholesale
marketplace did not decline as anticipated, however, giving us unusually high third quarter wholesale gross
profits. In the fourth quarter, which coincides with the time of the year when dealers are building inventories for
the higher-volume spring and summer months, we typically experience our strongest wholesale prices and
margins. The combination of continuing strong industry demand and the normal seasonal trends lifted wholesale
pricing to further inflated levels in the fourth quarter, again benefiting our wholesale gross profits.
Fiscal 2005 Versus Fiscal 2004. The increase in wholesale gross profit dollars per unit in fiscal 2005
reflected the implementation of and refinement to our in-store appraisal strategy. Under the revised strategy,
the acquisition cost of wholesale vehicles decreased resulting in higher wholesale gross profit.
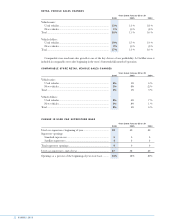
Other Gross Profit
Fiscal 2006 Versus Fiscal 2005. Other gross profit dollars per unit increased modestly in fiscal 2006. The
improvement was primarily the result of improved penetration in sales of extended service plans, which have
no associated cost of sales, and the growth in service profits. The service department, which is the only
category within other sales and revenues that has an associated cost of sales, reported higher profits reflecting
the greater overhead expense absorption provided by the higher vehicle sales and reconditioning volumes.
Fiscal 2005 Versus Fiscal 2004. The decline in other gross profit dollars per unit in fiscal 2005 resulted
from a combination of factors, including a decrease in service profits, the rollout of the subprime lender, and
the elimination of appraisal purchase processing fees as part of the new in-store appraisal strategy. Service
profits declined in fiscal 2005, reflecting, in part, the slower used vehicle sales pace and the associated
deleveraging of service and reconditioning overhead costs. Third-party finance fees also declined in fiscal 2005,
reflecting the discount at which our subprime lender purchases automobile loans, which more than offset the
growth in fees received from our other third-party lenders.