CarMax 2006 Annual Report Download - page 28
Download and view the complete annual report
Please find page 28 of the 2006 CarMax annual report below. You can navigate through the pages in the report by either clicking on the pages listed below, or by using the keyword search tool below to find specific information within the annual report.-
 1
1 -
2
-
3
-
4
-
5
-
6
-
7
-
8
-
9
-
10
-
11
-
12
-
13
-
14
-
15
-
16
-
17
-
 18
18 -
 19
19 -
 20
20 -
 21
21 -
 22
22 -
 23
23 -
 24
24 -
 25
25 -
 26
26 -
 27
27 -
 28
28 -
 29
29 -
 30
30 -
 31
31 -
 32
32 -
 33
33 -
 34
34 -
 35
35 -
 36
36 -
 37
37 -
 38
38 -
39
-
40
-
41
-
42
-
43
-
44
-
45
-
46
-
47
-
48
-
49
-
50
-
51
-
52
-
53
-
54
-
55
-
56
-
57
-
58
-
59
-
60
-
61
-
62
-
63
-
64
 |
 |

26
CARMAX 2006
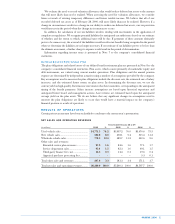
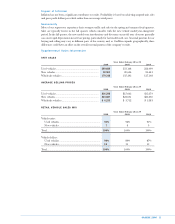
RETAIL STORES
As of February 28 or 29
2006 2005 2004
Mega superstores(1).................................................................................... 13 13 13
Standard superstores(2) .............................................................................. 34 29 24
Satellite superstores(3)................................................................................. 20 16 12
Total used superstores .............................................................................. 67 58 49
Co-located new car stores ........................................................................ 433
Total........................................................................................................... 71 61 52
(1) Generally 70,000 to 95,000 square feet on 20 to 35 acres.
(2) Generally 40,000 to 60,000 square feet on 10 to 25 acres.
(3) Generally 10,000 to 20,000 square feet on 4 to 10 acres.
We have a total of seven new car franchises, and we expect to maintain long-term relationships with the
automotive manufacturers that we currently represent. Two franchises are integrated within used car
superstores, and the remaining five franchises are operated from four facilities that are co-located with select
used car superstores.
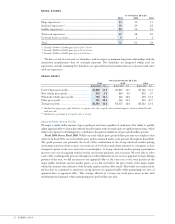
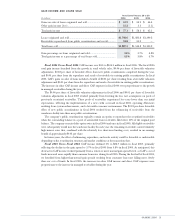
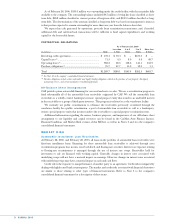
GROSS PROFIT
Years Ended February 28 or 29
2006 2005 2004
$ per unit(1) %(2) $ per unit(1) %(2) $ per unit(1) %(2)
Used vehicle gross profit................................. $1,808 11.0 $1,817 11.5 $1,742 11.3
New vehicle gross profit.................................. 934 3.9 860 3.6 872 3.7
Wholesale vehicle gross profit ........................ 700 16.1 464 12.2 359 10.4
Other gross profit ............................................ 391 58.5 366 55.3 472 67.7
Total gross profit.............................................. $2,544 12.6 $2,375 12.4 $2,323 12.4
(1) Calculated as category gross profit divided by its respective units sold, except the other and total categories, which are divided by total
retail units sold.
(2) Calculated as a percentage of its respective sales or revenue.
Used Vehicle Gross Profit
We target a similar dollar amount of gross profit per used unit, regardless of retail price. Our ability to quickly
adjust appraisal offers to stay in line with the broader market trade-in trends and our rapid inventory turns, which
reduce our exposure to declining prices, contribute to the general stability in our gross profit dollars per unit.
Fiscal 2006 Versus Fiscal 2005. While our used vehicle gross profit dollars per unit was similar to that
achieved in fiscal 2005, our used vehicle gross profits remained under some pressure throughout fiscal 2006.
The profit pressure was primarily the result of the combination of the strong wholesale market pricing
environment and our desire to price our retail cars at levels that made them attractive to consumers as they
compared options in the new and used car marketplace. A strong wholesale market pricing environment
increases our cost of acquiring vehicles both in our in-store purchases and at auction. We were able to offset
some of the resulting profit pressure through successful refinements in our in-store appraisal strategy. During
portions of the year, we did not increase our appraisal offers at the same rate as the steep increase in the
major public wholesale auction market prices, as we did not believe the price trends at the major public
wholesale auctions were reflective of the broader market trade-in offer trends. This belief was reinforced by
the fact that we continued to experience strong increases in appraisal traffic while maintaining our ratio of
appraisal buys to appraisal offers. This strategy allowed us to keep our retail prices more in line with
underlying retail demand, while maintaining gross profit dollars per unit.