CarMax 2006 Annual Report Download - page 32
Download and view the complete annual report
Please find page 32 of the 2006 CarMax annual report below. You can navigate through the pages in the report by either clicking on the pages listed below, or by using the keyword search tool below to find specific information within the annual report.-
 1
1 -
2
-
3
-
4
-
5
-
6
-
7
-
8
-
9
-
10
-
11
-
12
-
13
-
14
-
15
-
16
-
17
-
18
-
19
-
20
-
21
-
 22
22 -
 23
23 -
 24
24 -
 25
25 -
 26
26 -
 27
27 -
 28
28 -
 29
29 -
 30
30 -
 31
31 -
 32
32 -
 33
33 -
 34
34 -
 35
35 -
 36
36 -
 37
37 -
 38
38 -
 39
39 -
 40
40 -
 41
41 -
 42
42 -
43
-
44
-
45
-
46
-
47
-
48
-
49
-
50
-
51
-
52
-
53
-
54
-
55
-
56
-
57
-
58
-
59
-
60
-
61
-
62
-
63
-
64
 |
 |

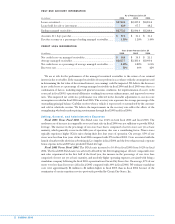
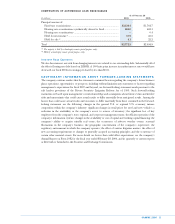
PAST DUE ACCOUNT INFORMATION
As of February 28 or 29
(In millions) 2006 2005 2004
Loans securitized................................................................................... $2,710.4 $2,427.2 $2,200.4
Loans held for sale or investment........................................................ 62.0 67.7 48.2
Ending managed receivables ................................................................ $2,772.5 $2,494.9 $2,248.6
Accounts 31+ days past due................................................................. $ 37.4 $ 31.1 $ 31.4
Past due accounts as a percentage of ending managed receivables ....... 1.35% 1.24% 1.40%
CREDIT LOSS INFORMATION
Years Ended February 28 or 29
(In millions) 2006 2005 2004
Net credit losses on managed receivables............................................ $ 18.4 $ 19.5 $ 21.1
Average managed receivables............................................................... $2,657.7 $2,383.6 $2,099.4
Net credit losses as a percentage of average managed receivables ....... 0.69% 0.82% 1.01%
Recovery rate ........................................................................................ 51% 46% 42%
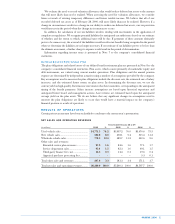
We are at risk for the performance of the managed securitized receivables to the extent of our retained
interest in the receivables. If the managed receivables do not perform in accordance with the assumptions used
in determining the fair value of the retained interest, our earnings could be impacted. We believe the decreases
in net credit losses as a percentage of average managed receivables in fiscal 2006 and fiscal 2005 were due to a
combination of factors, including improved general economic conditions, the implementation of a new credit
scorecard in fiscal 2003, operational efficiencies resulting from system enhancements, and improved recovery
rates. This improved net credit loss performance was reflected in the favorable adjustments to our loss rate
assumptions recorded in fiscal 2006 and fiscal 2005. The recovery rate represents the average percentage of the
outstanding principal balance CarMax receives when a vehicle is repossessed or surrendered by the customer
and sold at wholesale auction. We believe the improvements in the recovery rate reflect the effects of the
strengthening wholesale market pricing environment through fiscal 2005 and fiscal 2006.
Selling, General, and Administrative Expenses
Fiscal 2006 Versus Fiscal 2005. The SG&A ratio was 10.4% in both fiscal 2006 and fiscal 2005. The
moderate rate of increase in comparable store used unit sales in fiscal 2006 was not sufficient to provide SG&A
leverage. The increase in the percentage of our store base that is comprised of newer stores not yet at basic
maturity, which generally occurs in the fifth year of operation, also was a contributing factor. Newer stores
typically experience higher SG&A ratios during their first four years of operation. On average, 45% of our
stores were less than four years old in fiscal 2006 compared with 37% in fiscal 2005. Costs associated with the
launch of market-wide television advertising in Los Angeles in fiscal 2006 and the lower-than-normal corporate
bonus expense in fiscal 2005 also precluded SG&A leverage.
Fiscal 2005 Versus Fiscal 2004. The SG&A ratio increased to 10.4% in fiscal 2005 from 10.2% in fiscal
2004. The fiscal 2005 SG&A ratio was adversely affected by the deleveraging impact of lower comparable store
unit sales experienced in the first half of the fiscal year, the increase in the percentage of our store base
comprised of stores not yet at basic maturity, and modestly higher operating expenses associated with being a
standalone company following the fiscal 2003 separation from Circuit City Stores, Inc. On average, 37% of our
stores were less than four years old in fiscal 2005 compared with 30% in fiscal 2004. We estimate standalone
costs were approximately $3 million to $4 million higher in fiscal 2005 than in fiscal 2004 because of the
termination of certain transition services previously provided by Circuit City Stores, Inc.
30
CARMAX 2006