CarMax 2006 Annual Report Download - page 50
Download and view the complete annual report
Please find page 50 of the 2006 CarMax annual report below. You can navigate through the pages in the report by either clicking on the pages listed below, or by using the keyword search tool below to find specific information within the annual report.-
 1
1 -
2
-
3
-
4
-
5
-
6
-
7
-
8
-
9
-
10
-
11
-
12
-
13
-
14
-
15
-
16
-
17
-
18
-
19
-
20
-
21
-
22
-
23
-
24
-
25
-
26
-
27
-
28
-
29
-
30
-
31
-
32
-
33
-
34
-
35
-
36
-
37
-
38
-
39
-
 40
40 -
 41
41 -
 42
42 -
 43
43 -
 44
44 -
 45
45 -
 46
46 -
 47
47 -
 48
48 -
 49
49 -
 50
50 -
 51
51 -
 52
52 -
 53
53 -
 54
54 -
 55
55 -
 56
56 -
 57
57 -
 58
58 -
 59
59 -
 60
60 -
61
-
62
-
63
-
64
 |
 |
48
CARMAX 2006
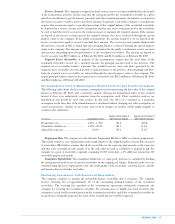
EFFECTIVE INCOME TAX RATE RECONCILIATION
Years Ended February 28 or 29
2006 2005 2004
Federal statutory income tax rate .................................................. 35.0% 35.0% 35.0%
State and local income taxes, net of federal benefit...................... 3.0%3.5%3.1%
Nondeductible items....................................................................... 0.3%0.3%0.4%
Effective income tax rate................................................................ 38.3% 38.8% 38.5%
DEFERRED TAX ASSETS AND LIABILITIES
As of February 28
(In thousands) 2006 2005
Deferred tax assets:
Accrued expenses................................................................................... $16,887 $12,381
Partnership basis.................................................................................... 6,229 —
Other ...................................................................................................... —100
Total gross deferred tax assets.................................................................... 23,116 12,481
Deferred tax liabilities:
Securitized receivables ........................................................................... 19,699 23,301
Prepaid expenses.................................................................................... 10,757 157
Inventory................................................................................................ 7,476 8,515
Depreciation and amortization.............................................................. 4,508 7,744
Other ...................................................................................................... 27 —
Partnership basis.................................................................................... —4,106
Total gross deferred tax liabilities............................................................... 42,467 43,823
Net deferred tax liability............................................................................. $19,351 $31,342
Based on the company’s historical and current pretax earnings, management believes the amount of gross
deferred tax assets will more likely than not be realized through future taxable income and future reversals of
existing temporary differences; therefore, no valuation allowance is necessary.
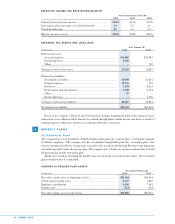
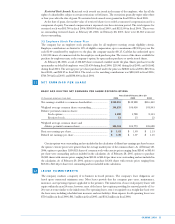
BENEFIT PLANS
(A) Retirement Plans
The company has a noncontributory defined benefit pension plan (the “pension plan”) covering the majority
of full-time employees. The company also has an unfunded nonqualified plan (the “restoration plan”) that
restores retirement benefits for certain senior executives who are affected by Internal Revenue Code limitations
on benefits provided under the pension plan. The company uses a fiscal year end measurement date for both
the pension plan and the restoration plan.
Assets. Assets used in calculating the funded status are measured at current market values. The restoration
plan is excluded since it is unfunded.
CHANGES IN PENSION PLAN ASSETS
Years Ended February 28
(In thousands) 2006 2005
Fair value of plan assets at beginning of year ........................................... $25,316 $16,404
Actual return on plan assets ....................................................................... 2,357 1,849
Employer contributions .............................................................................. 4,500 7,381
Benefits paid ................................................................................................ (213) (318)
Fair value of plan assets at end of year...................................................... $31,960 $25,316
8