CarMax 2006 Annual Report Download - page 38
Download and view the complete annual report
Please find page 38 of the 2006 CarMax annual report below. You can navigate through the pages in the report by either clicking on the pages listed below, or by using the keyword search tool below to find specific information within the annual report.-
 1
1 -
2
-
3
-
4
-
5
-
6
-
7
-
8
-
9
-
10
-
11
-
12
-
13
-
14
-
15
-
16
-
17
-
18
-
19
-
20
-
21
-
22
-
23
-
24
-
25
-
26
-
27
-
 28
28 -
 29
29 -
 30
30 -
 31
31 -
 32
32 -
 33
33 -
 34
34 -
 35
35 -
 36
36 -
 37
37 -
 38
38 -
 39
39 -
 40
40 -
 41
41 -
 42
42 -
 43
43 -
 44
44 -
 45
45 -
 46
46 -
 47
47 -
 48
48 -
49
-
50
-
51
-
52
-
53
-
54
-
55
-
56
-
57
-
58
-
59
-
60
-
61
-
62
-
63
-
64
 |
 |

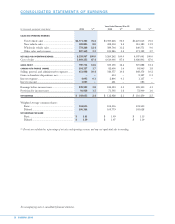
Years Ended February 28 or 29
(In thousands except per share data)
2006 %(1) 2005 %(1) 2004 %(1)
SALES AND OPERATING REVENUES:
Used vehicle sales ............................................. $4,771,325 76.2 $3,997,218 76.0 $3,470,615 75.5
New vehicle sales.............................................. 502,805 8.0 492,054 9.4 515,383 11.2
Wholesale vehicle sales .................................... 778,268 12.4 589,704 11.2 440,571 9.6
Other sales and revenues ................................. 207,569 3.3 181,286 3.4 171,122 3.7
NET SALES AND OPERATING REVENUES
.............................. 6,259,967 100.0 5,260,262 100.0 4,597,691 100.0
Cost of sales ........................................................... 5,469,253 87.4 4,610,066 87.6 4,026,803 87.6
GROSS PROFIT
............................................................. 790,714 12.6 650,196 12.4 570,888 12.4
CARMAX AUTO FINANCE INCOME
.................................... 104,327 1.7 82,656 1.6 84,963 1.8
Selling, general, and administrative expenses....... 651,988 10.4 546,577 10.4 468,374 10.2
Gain on franchise dispositions, net ....................... —— 633 — 2,327 0.1
Interest expense...................................................... 4,093 0.1 2,806 0.1 1,137 —
Interest income....................................................... 1,023 — 421 — 683 —
Earnings before income taxes................................ 239,983 3.8 184,523 3.5 189,350 4.1
Provision for income taxes .................................... 91,928 1.5 71,595 1.4 72,900 1.6
NET EARNINGS
............................................................. $ 148,055 2.4 $ 112,928 2.1 $ 116,450 2.5
Weighted average common shares:
Basic................................................................... 104,635 104,036 103,503
Diluted............................................................... 106,344 105,779 105,628
NET EARNINGS PER SHARE:
Basic................................................................... $ 1.41 $ 1.09 $ 1.13
Diluted............................................................... $ 1.39 $ 1.07 $ 1.10
(1) Percents are calculated as a percentage of net sales and operating revenues and may not equal totals due to rounding.
36
CARMAX 2006
CONSOLIDATED STATEMENTS OF EARNINGS
See accompanying notes to consolidated financial statements.