CarMax 2006 Annual Report Download - page 40
Download and view the complete annual report
Please find page 40 of the 2006 CarMax annual report below. You can navigate through the pages in the report by either clicking on the pages listed below, or by using the keyword search tool below to find specific information within the annual report.-
 1
1 -
2
-
3
-
4
-
5
-
6
-
7
-
8
-
9
-
10
-
11
-
12
-
13
-
14
-
15
-
16
-
17
-
18
-
19
-
20
-
21
-
22
-
23
-
24
-
25
-
26
-
27
-
28
-
29
-
 30
30 -
 31
31 -
 32
32 -
 33
33 -
 34
34 -
 35
35 -
 36
36 -
 37
37 -
 38
38 -
 39
39 -
 40
40 -
 41
41 -
 42
42 -
 43
43 -
 44
44 -
 45
45 -
 46
46 -
 47
47 -
 48
48 -
 49
49 -
 50
50 -
51
-
52
-
53
-
54
-
55
-
56
-
57
-
58
-
59
-
60
-
61
-
62
-
63
-
64
 |
 |

38
CARMAX 2006
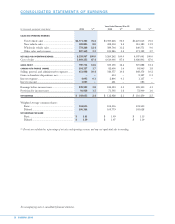
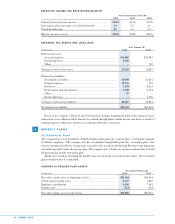
CONSOLIDATED STATEMENTS OF CASH FLOWS
See accompanying notes to consolidated financial statements.
Years Ended February 28 or 29
(In thousands)
2006 2005 2004
OPERATING ACTIVITIES:
Net earnings................................................................................................... $148,055 $112,928 $116,450
Adjustments to reconcile net earnings to net
cash provided by operating activities:
Depreciation and amortization ................................................................ 26,692 20,145 16,181
Amortization of restricted stock awards.................................................. 54 108 122
Gain on disposition of assets ................................................................... (764) (1,486) (1,462)
Provision for deferred income taxes........................................................ (11,991) (1,184) (1,298)
Changes in operating assets and liabilities:
Increase in accounts receivable, net ................................................... (454) (3,809) (15,909)
Decrease (increase) in automobile loan receivables
held for sale, net ............................................................................ 18,013 (3,371) (15,202)
Increase in retained interest in securitized receivables...................... (10,345) (1,975) (10,972)
(Increase) decrease in inventory......................................................... (93,133) (110,506) 389
Decrease (increase) in prepaid expenses and other current assets ... 1,797 (4,358) 3,986
(Increase) decrease in other assets...................................................... (5,975) 1,042 3,147
Increase in accounts payable, accrued expenses and other
current liabilities, and accrued income taxes................................ 47,461 35,876 48,570
Increase in deferred revenue and other liabilities.............................. 2,885 2,326 2,962
NET CASH PROVIDED BY OPERATING ACTIVITIES
.......................................................... 122,295 45,736 146,964
INVESTING ACTIVITIES:
Capital expenditures...................................................................................... (194,433) (230,080) (181,338)
Proceeds from sales of assets......................................................................... 78,340 88,999 107,493
NET CASH USED IN INVESTING ACTIVITIES
.................................................................. (116,093) (141,081) (73,845)
FINANCING ACTIVITIES:
(Decrease) increase in short-term debt, net .................................................. (64,734) 60,751 (51,605)
Issuance of long-term debt ............................................................................ 174,929 ——
Payments on long-term debt ......................................................................... (116,993) (509) —
Issuances of equity through stock incentive plans ....................................... 6,035 4,306 4,613
Purchases of shares for employee stock purchase plan ............................... (804) (747) (599)
NET CASH (USED IN) PROVIDED BY FINANCING ACTIVITIES
............................................ (1,567) 63,801 (47,591)
Increase (decrease) in cash and cash equivalents .............................................. 4,635 (31,544) 25,528
Cash and cash equivalents at beginning of year............................................... 17,124 48,668 23,140
CASH AND CASH EQUIVALENTS AT END OF YEAR
............................................................... $ 21,759 $ 17,124 $ 48,668
SUPPLEMENTAL DISCLOSURES OF CASH FLOW INFORMATION
Cash paid during the year for:
Interest ...................................................................................................... $ 7,928 $ 5,726 $ 4,695
Income taxes............................................................................................. $ 94,112 $ 72,022 $ 59,987
Noncash investing and financing activities:
Asset acquisitions from capitalization of leases....................................... $ 7,864 $ 29,258 $ —
Long-term debt obligations from capitalization of leases ....................... $ 7,864 $ 29,258 $ —