CarMax 2006 Annual Report Download - page 21
Download and view the complete annual report
Please find page 21 of the 2006 CarMax annual report below. You can navigate through the pages in the report by either clicking on the pages listed below, or by using the keyword search tool below to find specific information within the annual report.-
 1
1 -
2
-
3
-
4
-
5
-
6
-
7
-
8
-
9
-
10
-
 11
11 -
 12
12 -
 13
13 -
 14
14 -
 15
15 -
 16
16 -
 17
17 -
 18
18 -
 19
19 -
 20
20 -
 21
21 -
 22
22 -
 23
23 -
 24
24 -
 25
25 -
 26
26 -
 27
27 -
 28
28 -
 29
29 -
 30
30 -
 31
31 -
32
-
33
-
34
-
35
-
36
-
37
-
38
-
39
-
40
-
41
-
42
-
43
-
44
-
45
-
46
-
47
-
48
-
49
-
50
-
51
-
52
-
53
-
54
-
55
-
56
-
57
-
58
-
59
-
60
-
61
-
62
-
63
-
64
 |
 |

CARMAX 2006
19
We sell extended service plans on behalf of unrelated third parties who are the primary obligors. We have
no contractual liability to the customer under these third-party service plans. Extended service plan revenue
represents commissions from the unrelated third parties.
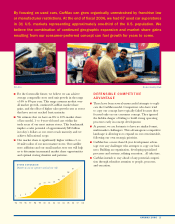
We are still at a relatively early stage in the national rollout of our retail concept. We believe the primary
driver for future earnings growth will be vehicle unit sales growth from comparable store sales increases and
from geographic expansion. We target a similar dollar amount of gross profit per used unit, regardless of
retail price. Used unit sales growth is our primary focus. We plan to open used car superstores at a rate of
approximately 15% to 20% of our used car superstore base each year. In fiscal 2007, we plan to focus our
store growth primarily on adding standard superstores in new mid-sized markets and satellite fill-in
superstores in established markets. After fiscal 2007, we expect to resume store growth in new large markets.
For the foreseeable future, we expect used unit comparable store sales increases to average in the range of 4%
to 8%, reflecting the multi-year ramp in sales at newly opened stores as they mature and continued market
share gains at stores that have reached basic maturity sales levels, which generally occurs in a store’s fifth
year of operation.
The principal challenges we face in expanding our store base include our ability to build our management
bench strength to support the store growth and our ability to procure suitable real estate at reasonable costs.
We staff each newly opened store with an experienced management team, generally including a location
general manager, operations manager, purchasing manager, and business office manager, as well as a
number of experienced sales managers and buyers. We must therefore continually recruit, train, and
develop managers and associates to fill the pipeline necessary to support future store openings. If at any
time we believed that the rate of store growth was causing our performance to falter, we would consider
slowing the growth rate.
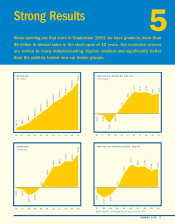
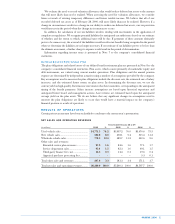
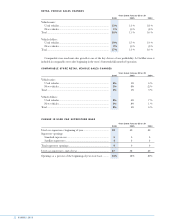
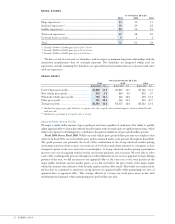
Fiscal 2006 Highlights
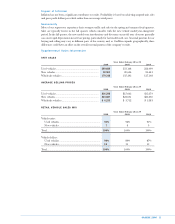
3Net sales and operating revenues increased 19% to $6.26 billion from $5.26 billion in fiscal 2005, and net
earnings increased 31% to $148.1 million, or $1.39 per share, from $112.9 million, or $1.07 per share.
3Total used vehicle unit sales increased 15%, reflecting the combination of the growth in our store base and a
4% increase in comparable store used unit sales.
3We opened nine used car superstores in fiscal 2006, including four standard superstores in new markets and
one standard and four satellite superstores in existing markets. Two of the superstore openings were in Los
Angeles, bringing our presence in this large market to five superstores and giving us the critical mass to
commence television advertising in this market.
3Our total gross profit per unit increased to $2,544 from $2,375 in fiscal 2005. Compared with the prior
year, used vehicle gross profit per unit was similar, and wholesale vehicle gross profit per unit increased
substantially. The wholesale gross profit benefited from the exceptionally strong wholesale pricing
environment, particularly in the second half of the fiscal year, and the success of our in-store appraisal
strategy.
3CAF income increased 26% to $104.3 million from $82.7 million in fiscal 2005, reflecting the growth in
retail vehicle sales and managed receivables. CAF income included a benefit of $0.09 per share for favorable
items, primarily valuation adjustments to the retained interest, in fiscal 2006, compared with a benefit of
$0.02 per share in fiscal 2005.
3Selling, general, and administrative expenses as a percent of net sales and operating revenues (the
“SG&A ratio”) was 10.4% in both fiscal 2006 and fiscal 2005. The moderate rate of increase in
comparable store used unit sales was not sufficient to provide SG&A leverage. The increase in the
percentage of our store base that is comprised of stores not yet at basic maturity, the launch of market-
wide television advertising in Los Angeles, and the lower-than-normal corporate bonus expense in fiscal
2005 were also factors precluding SG&A leverage. Stores generally have higher SG&A ratios during
their first four years of operation.
3Net cash provided by operations increased to $122.3 million from $45.7 million in fiscal 2005, reflecting the
improved net earnings and changes in working capital.