CarMax 2006 Annual Report Download - page 31
Download and view the complete annual report
Please find page 31 of the 2006 CarMax annual report below. You can navigate through the pages in the report by either clicking on the pages listed below, or by using the keyword search tool below to find specific information within the annual report.-
 1
1 -
2
-
3
-
4
-
5
-
6
-
7
-
8
-
9
-
10
-
11
-
12
-
13
-
14
-
15
-
16
-
17
-
18
-
19
-
20
-
 21
21 -
 22
22 -
 23
23 -
 24
24 -
 25
25 -
 26
26 -
 27
27 -
 28
28 -
 29
29 -
 30
30 -
 31
31 -
 32
32 -
 33
33 -
 34
34 -
 35
35 -
 36
36 -
 37
37 -
 38
38 -
 39
39 -
 40
40 -
 41
41 -
42
-
43
-
44
-
45
-
46
-
47
-
48
-
49
-
50
-
51
-
52
-
53
-
54
-
55
-
56
-
57
-
58
-
59
-
60
-
61
-
62
-
63
-
64
 |
 |

CARMAX 2006
29
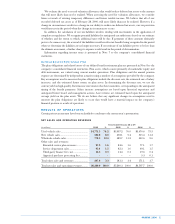
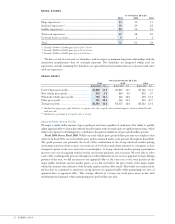
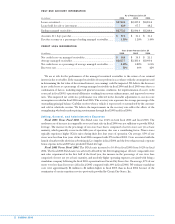
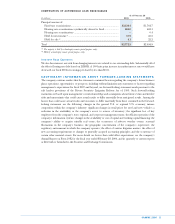
GAIN INCOME AND LOANS SOLD
Years Ended February 28 or 29
(In millions) 2006 2005 2004
Gains on sales of loans originated and sold............................................ $ 61.9 $ 54.9 $ 66.4
Other gain income (loss) .......................................................................... 15.2 3.3 (1.3)
Total gain income ..................................................................................... $ 77.1 $ 58.3 $ 65.1
Loans originated and sold........................................................................ $1,792.6 $1,483.8 $1,390.2
Receivables repurchased from public securitizations and resold............ 94.8 51.0 —
Total loans sold ......................................................................................... $1,887.5 $1,534.8 $1,390.2
Gain percentage on loans originated and sold........................................ 3.5% 3.7% 4.8%
Total gain income as a percentage of total loans sold............................. 4.1% 3.8% 4.7%
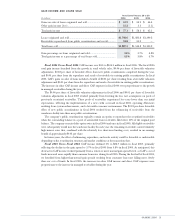
Fiscal 2006 Versus Fiscal 2005. CAF income rose 26% to $104.3 million in fiscal 2006. The fiscal 2006
total gain income benefited from the growth in retail vehicle sales, $0.06 per share of favorable valuation
adjustments, $0.02 per share of favorable effects from new public securitizations completed during the year,
and $0.01 per share from the repurchase and resale of receivables in existing public securitizations. In fiscal
2005, CAF’s gains on sales of loans included a benefit of $0.01 per share resulting from a favorable valuation
adjustment and $0.01 per share from the repurchase and resale of receivables in existing public securitizations.
The increases in other CAF income and direct CAF expenses in fiscal 2006 were proportionate to the growth
in managed receivables during the year.
The $0.06 per share of favorable valuation adjustments in fiscal 2006 and $0.01 per share of favorable
valuation adjustments in fiscal 2005 resulted primarily from lowering the loss rate assumptions on pools of
previously securitized receivables. These pools of receivables experienced loss rates lower than our initial
expectations, reflecting the implementation of a new credit scorecard in fiscal 2003, operating efficiencies
resulting from system enhancements, and a favorable economic environment. The $0.02 per share favorable
effect of new public securitizations in fiscal 2006 resulted from the refinancing of receivables from the
warehouse facility into three new public securitizations.
The company’s public securitizations typically contain an option to repurchase the securitized receivables
when the outstanding balance in a pool of automobile loan receivables falls below 10% of the original pool
balance. The company exercised this option twice in fiscal 2006 and once in fiscal 2005. All eligible receivables
were subsequently resold into the warehouse facility. In each year, the remaining receivables carried relatively
high interest rates that, combined with the relatively low short-term funding costs, resulted in an earnings
benefit of approximately $0.01 per share.
In future years, the effect of refinancing, repurchase, and resale activity could be favorable or unfavorable
depending on the securitization structure and market conditions at the transaction date.
Fiscal 2005 Versus Fiscal 2004. CAF income declined 3% to $82.7 million in fiscal 2005, primarily
reflecting the decline in the gain spread to 3.7% in fiscal 2005 from 4.8% in fiscal 2004. As anticipated, this
decrease in CAF income resulted primarily from a return to more normal gain spread levels, as CAF’s cost of
funds increased more rapidly than consumer loan rates during fiscal 2005. During the first half of fiscal 2004,
we benefited from higher-than-normal gain spreads resulting from consumer loan rates falling more slowly
than our cost of funds. In fiscal 2005, the increases in other CAF income and direct CAF expenses were
proportionate to the increase in managed receivables during the year.