Blackberry 2006 Annual Report Download - page 76
Download and view the complete annual report
Please find page 76 of the 2006 Blackberry annual report below. You can navigate through the pages in the report by either clicking on the pages listed below, or by using the keyword search tool below to find specific information within the annual report.-
 1
1 -
2
-
3
-
4
-
5
-
6
-
7
-
8
-
9
-
10
-
11
-
12
-
13
-
14
-
15
-
16
-
17
-
18
-
19
-
20
-
21
-
22
-
23
-
24
-
25
-
26
-
27
-
28
-
29
-
30
-
31
-
32
-
33
-
34
-
35
-
36
-
37
-
38
-
39
-
40
-
41
-
42
-
43
-
44
-
45
-
46
-
47
-
48
-
49
-
50
-
51
-
52
-
53
-
54
-
55
-
56
-
57
-
58
-
59
-
60
-
61
-
62
-
63
-
64
-
65
-
 66
66 -
 67
67 -
 68
68 -
 69
69 -
 70
70 -
 71
71 -
 72
72 -
 73
73 -
 74
74 -
 75
75 -
 76
76 -
 77
77 -
 78
78 -
 79
79 -
 80
80
 |
 |

Research In Motion Limited
74
Research In Motion Limited • Incorporated Under the Laws of Ontario (In thousands of United States dollars, except per share data, and except as otherwise indicated)
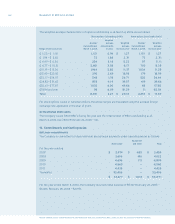
While the Company sells its products and services to a variety of customers, three customers comprised
18%, 13% and 13% of trade receivables as at March 4, 2006 (February 26, 2005 — two customers comprised
23% and 12%). Additionally, four customers comprised 19%, 16%, 12% and 12% of the Company’s revenue
(February 26, 2005 — four customers comprised 14%, 13%, 13% and 10%; February 28, 2004 — two
customers comprised 15% and 13%).
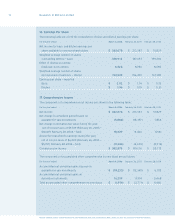
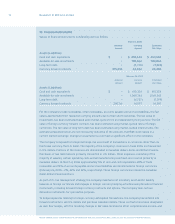
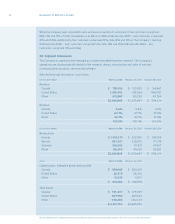
20. Segment Disclosures
The Company is organized and managed as a single reportable business segment. The Company’s
operations are substantially all related to the research, design, manufacture and sales of wireless
communications products, services and software.
Selected nancial information is as follows:
For the year ended February 26, 2005 February 28, 2004
Revenue
Canada $ 123,853 $ 54,847
United States 914,364 446,000
Other 312,230 93,769
$ 1,350,447 $ 594,616
Revenue
Canada 9.2% 9.2%
United States 67.7% 75.0%
Other 23.1% 15.8%
100.0% 100.0%
For the year ended February 26, 2005 February 28, 2004
Revenue mix
Devices $ 933,989 $ 343,154
Service 235,015 171,215
Software 131,81 1 47,427
Other 49,632 32,820
$ 1,350,447 $ 594,616
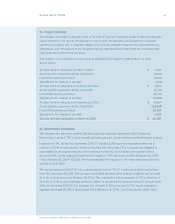
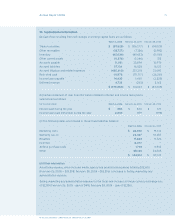
As at February 26, 2005
Capital assets, intangible assets and goodwill
Canada $ 290,691
United States 26,216
Other 5,97 1
$ 322,878
Total assets
Canada $ 679,309
United States 829,534
Other 1,1 12, 1 5 1
$ 2,620,994