Blackberry 2006 Annual Report Download - page 34
Download and view the complete annual report
Please find page 34 of the 2006 Blackberry annual report below. You can navigate through the pages in the report by either clicking on the pages listed below, or by using the keyword search tool below to find specific information within the annual report.-
 1
1 -
2
-
3
-
4
-
5
-
6
-
7
-
8
-
9
-
10
-
11
-
12
-
13
-
14
-
15
-
16
-
17
-
18
-
19
-
20
-
21
-
22
-
23
-
 24
24 -
 25
25 -
 26
26 -
 27
27 -
 28
28 -
 29
29 -
 30
30 -
 31
31 -
 32
32 -
 33
33 -
 34
34 -
 35
35 -
 36
36 -
 37
37 -
 38
38 -
 39
39 -
 40
40 -
 41
41 -
 42
42 -
 43
43 -
 44
44 -
45
-
46
-
47
-
48
-
49
-
50
-
51
-
52
-
53
-
54
-
55
-
56
-
57
-
58
-
59
-
60
-
61
-
62
-
63
-
64
-
65
-
66
-
67
-
68
-
69
-
70
-
71
-
72
-
73
-
74
-
75
-
76
-
77
-
78
-
79
-
80
 |
 |

Research In Motion Limited
32
Research In Motion Limited • Incorporated Under the Laws of Ontario (In thousands of United States dollars, except per share data, and except as otherwise indicated)
For the fourth quarter of scal 2005, the Company’s net income tax recovery of $144.6 million primarily
related to the Company’s recognition of its deferred income tax assets. As at February 26, 2005, the
Company determined that it was, more likely than not, that it could realize the full value of its deferred
income tax assets and that a valuation allowance was no longer required. Accordingly, the Company
recognized the full value of its deferred income tax assets on its balance sheet in the fourth quarter of
scal 2005.
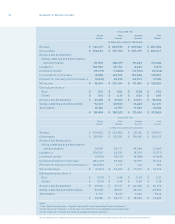
Net Income
Net income was $18.4 million, or $0.10 basic and diluted EPS, in the fourth quarter of scal 2006,
compared to a net loss of $2.6 million, or $0.01 basic EPS and $0.01 diluted EPS, in the prior year’s fourth
quarter. Both scal 2006 and scal 2005 included litigation provisions of $162.5 million and $294.2 million
respectively relating to the NTP litigation matter (see above).
The weighted average number of shares outstanding was 185.6 million common shares for basic EPS
and 191.5 million common shares for diluted EPS for the quarter ended March 4, 2006, compared to
189.2 million common shares for basic EPS and 189.2 million common shares for diluted EPS for the
quarter ended February 26, 2005.
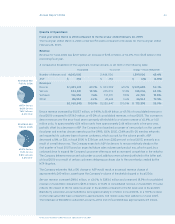
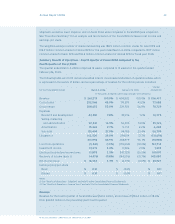
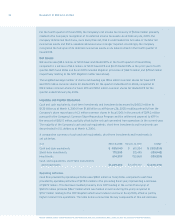
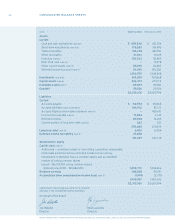
Liquidity and Capital Resources
Cash and cash equivalents, short-term investments and investments decreased by $430.3 million to
$1.25 billion as at March 4, 2006 from $1.68 billion as at February 26, 2005 resulting primarily from the
Company’s share repurchase of 6.3 million common shares in scal 2006 in the amount of $391.2 million
pursuant to the Company’s Common Share Repurchase Program and the settlement payment to NTP in
the amount of $612.5 million, partially offset by the net cash generated from operations in the current year.
The majority of the Company’s cash and cash equivalents, short-term investments and investments are
denominated in U.S. dollars as at March 4, 2006.
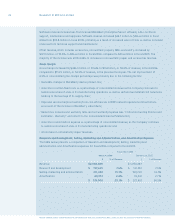
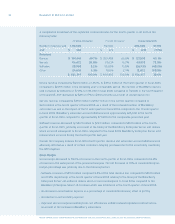
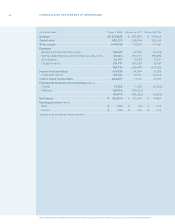
A comparative summary of cash and cash equivalents, short-term investments and investments is
set out below.
As at February 26, 2005
Cash and cash equivalents $ 610,354
Short-term investments 315,495
Investments 753,868
Cash, cash equivalents, short-term investments
and investments $ 1,679,717
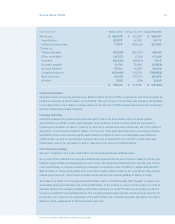
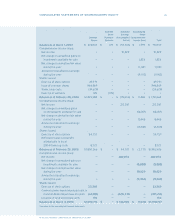
Cash ow provided by operating activities was $150.1 million in scal 2006, compared to cash ow
provided by operating activities of $278.0 million in the preceding scal year, representing a decrease
of $127.9 million. This decrease resulted primarily from NTP funding in the current scal year of
$500.5 million (includes $86.7 million which was funded in escrow during the year) compared to
$75.7 million relating to the NTP litigation which was funded in escrow in scal 2005, offset in part by
higher income from operations. The table below summarizes the key components of this net decrease.