Blackberry 2006 Annual Report Download - page 22
Download and view the complete annual report
Please find page 22 of the 2006 Blackberry annual report below. You can navigate through the pages in the report by either clicking on the pages listed below, or by using the keyword search tool below to find specific information within the annual report.-
 1
1 -
2
-
3
-
4
-
5
-
6
-
7
-
8
-
9
-
10
-
11
-
 12
12 -
 13
13 -
 14
14 -
 15
15 -
 16
16 -
 17
17 -
 18
18 -
 19
19 -
 20
20 -
 21
21 -
 22
22 -
 23
23 -
 24
24 -
 25
25 -
 26
26 -
 27
27 -
 28
28 -
 29
29 -
 30
30 -
 31
31 -
 32
32 -
33
-
34
-
35
-
36
-
37
-
38
-
39
-
40
-
41
-
42
-
43
-
44
-
45
-
46
-
47
-
48
-
49
-
50
-
51
-
52
-
53
-
54
-
55
-
56
-
57
-
58
-
59
-
60
-
61
-
62
-
63
-
64
-
65
-
66
-
67
-
68
-
69
-
70
-
71
-
72
-
73
-
74
-
75
-
76
-
77
-
78
-
79
-
80
 |
 |

Research In Motion Limited
20
Research In Motion Limited • Incorporated Under the Laws of Ontario (In thousands of United States dollars, except per share data, and except as otherwise indicated)
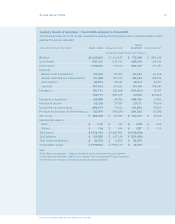
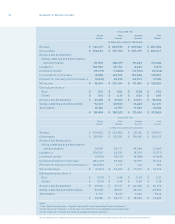
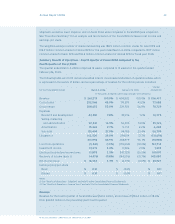
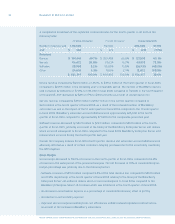
The following table sets forth certain consolidated statement of operations data expressed as
a percentage of revenue for the periods indicated:
Fiscal Year Ended February 26, 2005 February 28, 2004
Revenue 100.0% 100.0%
Cost of sales 47.1% 54.4%
Gross margin 52.9% 45.6%
Expenses
Research and development 7.5% 10.5%
Selling, marketing and administration 14.1% 18.2%
Amortization 2.7% 4.8%
Sub-total 24.3% 33.5%
Litigation 26.1% 5.9%
50.4% 39.4%
Income from operations 2.5% 6.2%
Investment income 2.7% 1.8%
Income before income taxes 5.2% 8.0%
Provision for (recovery of) income taxes (10.5%) (0.7%)
Net income 15.7% 8.7%
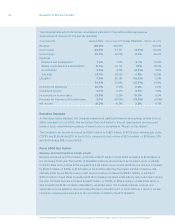
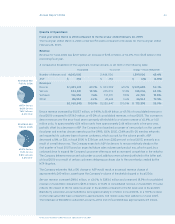
Executive Summary
As the above tables highlight, the Company experienced signicant revenue and earnings growth in scal
2006 compared to scal 2005. The key factors that contributed to this net improvement are discussed
below. A more comprehensive analysis of these factors is presented in “Results of Operations”.
The Company’s net income increased by $168.7 million to $382.1 million, or $2.02 basic earnings per share
(“EPS”) and $1.96 diluted EPS, in scal 2006, compared to net income of $213.4 million, or $1.14 basic EPS
and $1.09 diluted EPS, in scal 2005.
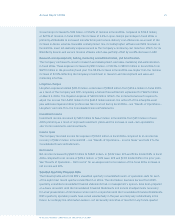
Fiscal 2006 Key Factors
Revenue increased by $715.4 million, or 53.0%, to $2.07 billion in scal 2006 compared to $1.35 billion in
the preceding scal year. The number of BlackBerry devices sold increased by 1.6 million units, or 65.4%,
to 4.04 million units in scal 2006 compared to 2.44 million units in scal 2005. Device revenue increased
by $505.7 million, or 54.1%, to $1.44 billion in scal 2006 reecting the higher number of devices sold,
partially offset by a 6.8% decrease in ASP. Service revenue increased by $148.0 million, or 63.0% to
$383.0 million in scal 2006 consistent with the Company’s increase in BlackBerry relay subscribers during
the year. Software revenue increased by $24.7 million, or 18.8%, to $156.6 million in scal 2006 which is
also consistent with the increase in BlackBerry subscriber base. The Company believes revenue and
subscriber account additions were adversely affected in the latter part of scal 2006 as a result of certain
customers delaying purchases due to the uncertainty created by the NTP litigation.