Blackberry 2006 Annual Report Download - page 31
Download and view the complete annual report
Please find page 31 of the 2006 Blackberry annual report below. You can navigate through the pages in the report by either clicking on the pages listed below, or by using the keyword search tool below to find specific information within the annual report.-
 1
1 -
2
-
3
-
4
-
5
-
6
-
7
-
8
-
9
-
10
-
11
-
12
-
13
-
14
-
15
-
16
-
17
-
18
-
19
-
20
-
 21
21 -
 22
22 -
 23
23 -
 24
24 -
 25
25 -
 26
26 -
 27
27 -
 28
28 -
 29
29 -
 30
30 -
 31
31 -
 32
32 -
 33
33 -
 34
34 -
 35
35 -
 36
36 -
 37
37 -
 38
38 -
 39
39 -
 40
40 -
 41
41 -
42
-
43
-
44
-
45
-
46
-
47
-
48
-
49
-
50
-
51
-
52
-
53
-
54
-
55
-
56
-
57
-
58
-
59
-
60
-
61
-
62
-
63
-
64
-
65
-
66
-
67
-
68
-
69
-
70
-
71
-
72
-
73
-
74
-
75
-
76
-
77
-
78
-
79
-
80
 |
 |

Research In Motion Limited • Incorporated Under the Laws of Ontario (In thousands of United States dollars, except per share data, and except as otherwise indicated)
Annual Report 2006 29
For the years ended March 4, 2006, February 26, 2005 and February 28, 2004
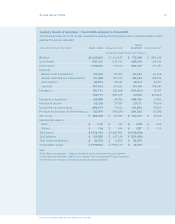
shipments as well as lower litigation costs in scal 2006 when compared to scal 2005 (see Litigation).
See “Executive Summary” for an analysis and reconciliation of the scal 2006 increase in net income and
earnings per share.
The weighted average number of shares outstanding was 188.9 million common shares for basic EPS and
194.9 million common shares for diluted EPS for the year ended March 4, 2006 compared to 187.7 million
common shares for basic EPS and 196.4 million common shares for diluted EPS for scal year 2005.
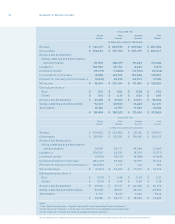
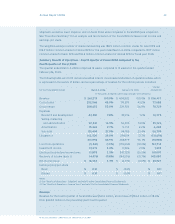
Summary Results of Operations – Fourth Quarter of Fiscal 2006 Compared to the
Fourth Quarter of Fiscal 2005
The quarter ended March 4, 2006 comprised 14 weeks compared to 13 weeks for the quarter ended
February 26, 2005.
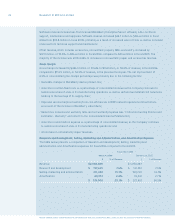
The following table sets forth certain unaudited interim consolidated statement of operations data, which
is expressed in thousands of dollars and as a percentage of revenue for the interim periods indicated:
Change
For the Three Months Ended February 26, 2005 2006/2005
(in thousands, except for percentages and per share amounts)
Revenue $ 404,802 100.0%
Cost of sales 174,878 43.2%
Gross margin 229,924 56.8%
Expenses
Research and development 29,076 7.2%
Selling, marketing
and administration 56,595 14.0%
Amortization 9,1 14 2.2%
Sub-total 94,785 23.4%
Litigation (1) 294,194 72.7%
388,979 96. 1%
Loss from operations (159,055) (39.3%)
Investment income 11,926 2.9%
Earnings (loss) before income taxes (147,129) (36.3%)
Recovery of income taxes (2) (144,556) (35.7%)
Net income (loss) $ (2,573) (0.6%)
Earnings (loss) per share
Basic $ (0.01)
Diluted $ (0.01)
Notes:
(1) See “Results of Operations – Litigation” and note 15 to the Consolidated Financial Statements.
(2) See “Results of Operations – Income Taxes” and note 9 to the Consolidated Financial Statements.
Revenue
Revenue for the fourth quarter of scal 2006 was $561.2 million, an increase of $156.4 million or 38.6%
from $404.8 million in the preceding year’s fourth quarter.