Blackberry 2006 Annual Report Download - page 72
Download and view the complete annual report
Please find page 72 of the 2006 Blackberry annual report below. You can navigate through the pages in the report by either clicking on the pages listed below, or by using the keyword search tool below to find specific information within the annual report.-
 1
1 -
2
-
3
-
4
-
5
-
6
-
7
-
8
-
9
-
10
-
11
-
12
-
13
-
14
-
15
-
16
-
17
-
18
-
19
-
20
-
21
-
22
-
23
-
24
-
25
-
26
-
27
-
28
-
29
-
30
-
31
-
32
-
33
-
34
-
35
-
36
-
37
-
38
-
39
-
40
-
41
-
42
-
43
-
44
-
45
-
46
-
47
-
48
-
49
-
50
-
51
-
52
-
53
-
54
-
55
-
56
-
57
-
58
-
59
-
60
-
61
-
 62
62 -
 63
63 -
 64
64 -
 65
65 -
 66
66 -
 67
67 -
 68
68 -
 69
69 -
 70
70 -
 71
71 -
 72
72 -
 73
73 -
 74
74 -
 75
75 -
 76
76 -
 77
77 -
 78
78 -
 79
79 -
 80
80
 |
 |

Research In Motion Limited
70
Research In Motion Limited • Incorporated Under the Laws of Ontario (In thousands of United States dollars, except per share data, and except as otherwise indicated)
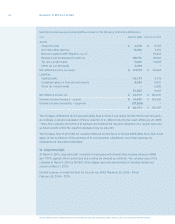
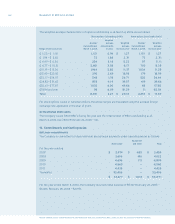
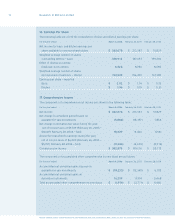
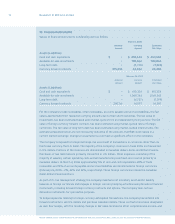
16. Earnings Per Share
The following table sets forth the computation of basic and diluted earnings per share.
For the year ended February 26, 2005 February 28, 2004
Net income for basic and diluted earnings per
share available to common shareholders $ 213,387 $ 51,829
Weighted-average number of shares
outstanding (000’s) — basic 187,653 159,300
Effect of dilutive securities:
Employee stock options 8,786 8,080
Weighted-average number of shares
and assumed conversions — diluted 196,439 167,380
Earnings per share — reported
Basic $ 1.14 $ 0.33
Diluted $ 1.09 $ 0.3 1
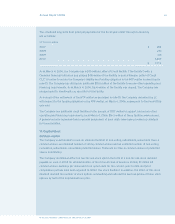
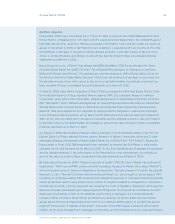
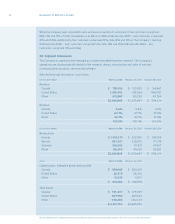
17. Comprehensive Income
The components of comprehensive net income are shown in the following table:
For the year ended February 26, 2005 February 28, 2004
Net income $ 213,387 $ 51,829
Net change in unrealized gains (losses) on
available-for-sale investments (18,357) 1,854
Net change in derivative fair value during the year,
net of income taxes of $9,539 (February 26, 2005 —
$10,429; February 28, 2004 — $nil) 8,446 11,941
Amounts reclassied to earnings during the year,
net of income taxes of $6,000 (February 26, 2005 —
$5,359; February 28, 2004 — $nil) (4,340) (9,912)
Comprehensive income $ 199,136 $ 55,712
The components of accumulated other comprehensive income (loss) are as follows:
For the year ended February 26, 2005 February 28, 2004
Accumulated net unrealized gains (losses) on
available-for-sale investments $ (12,345) $ 6,012
Accumulated net unrealized gains on
derivative instruments 9,574 5,468
Total accumulated other comprehensive income (loss) $ (2,771) $ 11,480