Blackberry 2006 Annual Report Download - page 26
Download and view the complete annual report
Please find page 26 of the 2006 Blackberry annual report below. You can navigate through the pages in the report by either clicking on the pages listed below, or by using the keyword search tool below to find specific information within the annual report.-
 1
1 -
2
-
3
-
4
-
5
-
6
-
7
-
8
-
9
-
10
-
11
-
12
-
13
-
14
-
15
-
 16
16 -
 17
17 -
 18
18 -
 19
19 -
 20
20 -
 21
21 -
 22
22 -
 23
23 -
 24
24 -
 25
25 -
 26
26 -
 27
27 -
 28
28 -
 29
29 -
 30
30 -
 31
31 -
 32
32 -
 33
33 -
 34
34 -
 35
35 -
 36
36 -
37
-
38
-
39
-
40
-
41
-
42
-
43
-
44
-
45
-
46
-
47
-
48
-
49
-
50
-
51
-
52
-
53
-
54
-
55
-
56
-
57
-
58
-
59
-
60
-
61
-
62
-
63
-
64
-
65
-
66
-
67
-
68
-
69
-
70
-
71
-
72
-
73
-
74
-
75
-
76
-
77
-
78
-
79
-
80
 |
 |

Research In Motion Limited
24
Research In Motion Limited • Incorporated Under the Laws of Ontario (In thousands of United States dollars, except per share data, and except as otherwise indicated)
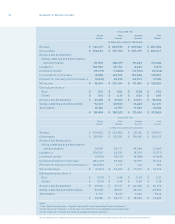
Software revenue includes fees from licensed BlackBerry Enterprise Server software, CALs, technical
support, maintenance and upgrades. Software revenue increased $24.7 million to $156.6 million in scal
2006 from $131.8 million in scal 2005, primarily as a result of increased sales of CALs as well as increased
revenues from technical support and maintenance.
Other revenue, which includes accessories, non-warranty repairs, NRE, and sundry, increased by
$37.0 million, or 74.5%, to $86.6 million in scal 2006, compared to $49.6 million in scal 2005. The
majority of the increase was attributable to increases in non-warranty repair and accessories revenue.
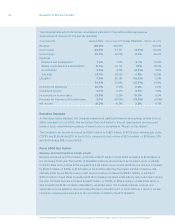
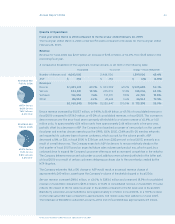
Gross Margin
Gross margin increased by $426.1 million, or 59.6%, to $1.14 billion, or 55.2% of revenue, in scal 2006,
compared to $714.5 million, or 52.9% of revenue, in the previous scal year. The net improvement of
2.3% in consolidated gross margin percentage was primarily due to the following factors:
• Favorable changes in BlackBerry device product mix;
• A decline in certain xed costs as a percentage of consolidated revenue as the Company continues to
realize economies of scale in its manufacturing operations as well as certain raw material cost reductions
relating to the leverage of its supply chain;
• Improved service margins resulting from cost efciencies in RIM’s network operations infrastructure
as a result of the increase in BlackBerry subscribers;
• Reductions in device unit warranty rates and net warranty expense (see “Critical Accounting Policies and
Estimates – Warranty” and note 13 to the Consolidated Financial Statements);
• A decline in amortization expense as a percentage of consolidated revenue, as the Company continues
to realize economies of scale in its manufacturing operations; and
• An increase in non-warranty repair revenues.
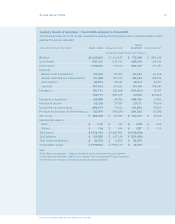
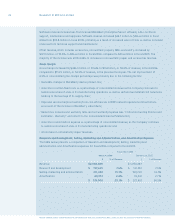
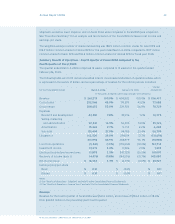
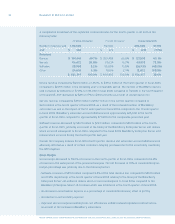
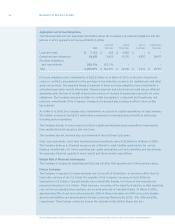
Research and Development, Selling, Marketing and Administration, and Amortization Expense
The table below presents a comparison of Research and development, Selling, marketing and
administration, and Amortization expenses for scal 2006 compared to scal 2005.
Fiscal Year Ended
February 26, 2005
$ % of Revenue
Revenue $ 1,350,447
Research and development $ 101,180 7.5%
Selling, marketing and administration 190,730 14.1%
Amortization 35,941 2.7%
$ 327,851 24.3%