Avon 2000 Annual Report Download - page 5
Download and view the complete annual report
Please find page 5 of the 2000 Avon annual report below. You can navigate through the pages in the report by either clicking on the pages listed below, or by using the keyword search tool below to find specific information within the annual report.-
 1
1 -
 2
2 -
 3
3 -
 4
4 -
 5
5 -
 6
6 -
 7
7 -
 8
8 -
 9
9 -
 10
10 -
 11
11 -
 12
12 -
 13
13 -
 14
14 -
 15
15 -
 16
16 -
17
-
18
-
19
-
20
-
21
-
22
-
23
-
24
-
25
-
26
-
27
-
28
-
29
-
30
-
31
-
32
-
33
-
34
-
35
-
36
-
37
-
38
-
39
-
40
-
41
-
42
-
43
 |
 |

Interest income in 2000 of $8.5 versus the prior
year decreased $2.6 primarily resulting from reduced
interest rates in Brazil and Mexico during 2000. Interest
income in 1999 of $11.1 decreased $4.8 versus 1998
mainly due to a tax refund claim recognized in 1998.
In 2000, other expense (income) net was $10.8
unfavorable to 1999 mainly due to favorable foreign
exchange in 1999 resulting from gains on Brazilian for-
ward contracts and, to a lesser extent, a value added tax
refund in China in 1999, partially offset by favorable
comparisons versus 1999, primarily in Europe and the
Pacific. In 1999, other expense (income) net was $12.2
unfavorable to 1998 due primarily to unfavorable net for-
eign exchange in 1999 resulting from exchange losses,
primarily in Europe and Latin America.
Income taxes were $201.7 in 2000 and the effective
tax rate was 29.2% compared with $204.2 in 1999 and
an effective tax rate of 40.3%. Excluding the effect of a
federal income tax refund in 2000 and special and non-
recurring charges in 1999, the effective tax rate was
35.0% and 35.5% in 2000 and 1999, respectively. The
effective tax rate was lower in 2000 versus 1999 due to
the settlement of foreign audits, dividend planning, uti-
lization of net operating loss carryforwards and the mix
of earnings and income tax rates of the international
subsidiaries. Income taxes in 1998 were $190.8 and the
effective tax rate was 41.9% (36.4% excluding the effect
of the special and non-recurring charges).
Inflation in the United States has remained at a rel-
atively low level during the last three years and has not
had a major effect on Avon’s results of operations. Many
countries in which Avon has operations have experienced
higher rates of inflation than the United States, including
Venezuela and Russia, which experienced high cumula-
tive rates of inflation over the past three years. Mexico
was converted to non-hyperinflationary status beginning
January 1, 1999 due to reduced cumulative inflation rates
during the three-year period 1996 through 1998.
35
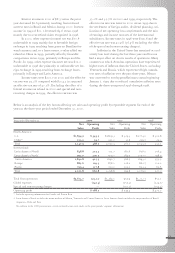
Years ended December 31 2000 1999 1998
Net Operating Net Operating Net Operating
Sales Profit Sales Profit Sales Profit
North America:
u.s. $1,894.9 $ 343.5 $1,809.3 $ 329.3 $1,774.0 $ 302.8
Other* 253.0 24.7 241.0 31.8 259.7 29.3
Total 2,147.9 368.2 2,050.3 361.1 2,033.7 332.1
International:
Latin America North†848.8 215.2 731.7 181.6 636.0 156.4
Latin America South†992.0 200.3 909.0 184.9 1,057.0 198.9
Latin America 1,840.8 415.5 1,640.7 366.5 1,693.0 355.3
Europe 885.6 129.5 878.0 126.2 862.7 102.2
Pacific 799.4 117.8 720.1 102.1 623.3 62.5
Total 3,525.8 662.8 3,238.8 594.8 3,179.0 520.0
Total from operations $5,673.7 1,031.0 $5,289.1 955.9 $5,212.7 852.1
Global expenses (242.3) (255.3) (224.5)
Special and non-recurring charges — (151.2) (154.4)
Operating profit $ 788.7 $ 549.4 $ 473.2
* Includes operating information for Canada and Puerto Rico.
† Latin America North includes the major markets of Mexico, Venezuela and Central America. Latin America South includes the major markets of Brazil,
Argentina, Chile and Peru.
To conform to the 2000 presentation, certain reclassifications were made to the prior periods’ segment information.
Below is an analysis of the key factors affecting net sales and operating profit by reportable segment for each of the
years in the three-year period ended December 31, 2000.