Avon 2000 Annual Report Download - page 40
Download and view the complete annual report
Please find page 40 of the 2000 Avon annual report below. You can navigate through the pages in the report by either clicking on the pages listed below, or by using the keyword search tool below to find specific information within the annual report.-
 1
1 -
2
-
3
-
4
-
5
-
6
-
7
-
8
-
9
-
10
-
11
-
12
-
13
-
14
-
15
-
16
-
17
-
18
-
19
-
20
-
21
-
22
-
23
-
24
-
25
-
26
-
27
-
28
-
29
-
 30
30 -
 31
31 -
 32
32 -
 33
33 -
 34
34 -
 35
35 -
 36
36 -
 37
37 -
 38
38 -
 39
39 -
 40
40 -
 41
41 -
 42
42 -
 43
43
 |
 |

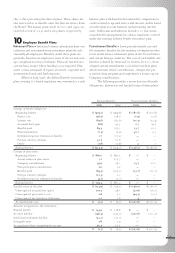
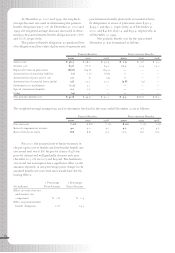
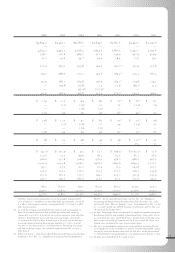
Eleven-Year Review
Avon Products, Inc.
In millions, except per share and employee data
70
(1) For the year ended December 31, 2000, the Company adopted the provisions
of Emerging Issues Task Force (“eitf”) 00-10, “Accounting for Shipping
and Handling Fees and Costs,” which requires that amounts billed to cus-
tomers for shipping and handling fees be classified as revenues. 1999 and
1998 have been restated to reflect shipping and handling fees, previously
reported in Marketing, distribution and administrative expenses, in Other
revenue in the Consolidated Statements of Income.
(2) For the year ended December 31, 2000, the Company recorded a charge of
$6.7 million, after tax, to reflect the adoption of Staff Accounting Bulletin
(“sab”) No. 101, “Revenue Recognition in Financial Statements.” This
charge is reflected as a cumulative effect of an accounting change in the
Consolidated Statements of Income.
(3) For purposes of calculating diluted earnings per share for the year ended
December 31 , 2000, after tax interest expense of $4.5, applicable to
Convertible Notes, has been added back to net income.
(4) Certain reclassifications have been made to conform to the current full year
presentation.
(5) Two-for-one stock splits were distributed in September 1998 and June 1996.
All per share data in this report, unless indicated, have been restated to
reflect the splits.
(6) Effective for the year ended December 31, 1997, the Company adopted fas
No. 128, “Earnings per Share.” fas No. 128 establishes standards for com-
puting and presenting earnings per share (“eps”) and replaces the presenta-
tion of previously disclosed eps with both basic and diluted eps. Based
upon the Company’s capitalization structure, the eps amounts calculated
in accordance with fas No. 128 approximated the Company’s eps amounts
in accordance with Accounting Principles Board Opinion No. 15, “Earnings
per Share.” All prior period eps data have been restated in accordance with
fas No. 128.
(7) Avon’s calculation of full-time equivalents, or number of employees,
was revised in 1999. Restatements of prior year data are not available, and
2000 1999 1998 1997
Income data
Net sales $5,673.7 $5,289.1 $5,212.7 $ 5,079.4
Other revenue 40.9(1) 38.8(1) 35.0(1) —
Total revenue 5,714.6 5,327.9 5,247.7 5,079.4
Operating profit (4) 788.7 549.4 473.2 537.8
Interest expense (4) 84.7 43.2 34.7 35.5
Income from continuing operations before taxes, minority interest
and cumulative effect of accounting changes 691.0 506.6(8) 455.9(8) 534.9
Income from continuing operations before minority interest and
cumulative effect of accounting changes 489.3 302.4(8) 265.1(8) 337.0
Income from continuing operations before cumulative effect of
accounting changes 485.1 302.4(8) 270.0(8) 338.8
(Loss) income from discontinued operations, net ————
Cumulative effect of accounting changes, net (6.7)(2) ———
Net income 478.4 302.4(8) 270.0(8) 338.8
Earnings (loss) per share– basic (5) (6)
Continuing operations $2.04 $ 1.18(8) $1.03
(8) $1.28
Discontinued operations ————
Cumulative effect of accounting changes (.03) ———
Net income 2.01 1.18(8) 1.03(8) 1.28
Earnings (loss) per share– diluted (5) (6)
Continuing operations $2.02
(3) $1.17
(8) $1.02
(8) $1.27
Discontinued operations ————
Cumulative effect of accounting changes (.03) ———
Net income 1.99(3) 1.17(8) 1.02(8) 1.27
Cash dividends per share
Common $ .74 $ .72 $ .68 $ .63
Preferred ————
Balance sheet data
Working capital $ 186.4 $ (375.0) $ 11.9 $ (11.9)
Capital expenditures 193.5 203.4 189.5 169.4
Property, plant and equipment, net 768.4 734.8 669.9 611.0
Total assets 2,826.4 2,528.6 2,433.5 2,272.9
Debt maturing within one year 105.4 306.0 55.3 132.1
Long-term debt 1,108.2 701.4 201.0 102.2
Total debt 1,213.6 1,007.4 256.3 234.3
Shareholders’ (deficit) equity (215.8) (406.1) 285.1 285.0
Number of employees
United States 9,800 9,700 8,000 8,100
International 33,200 30,800 25,900 26,900
Total employees(7) 43,000 40,500 33,900 35,000