Avon 2000 Annual Report Download - page 10
Download and view the complete annual report
Please find page 10 of the 2000 Avon annual report below. You can navigate through the pages in the report by either clicking on the pages listed below, or by using the keyword search tool below to find specific information within the annual report.-
 1
1 -
 2
2 -
 3
3 -
 4
4 -
 5
5 -
 6
6 -
 7
7 -
 8
8 -
 9
9 -
 10
10 -
 11
11 -
 12
12 -
 13
13 -
 14
14 -
 15
15 -
 16
16 -
 17
17 -
 18
18 -
 19
19 -
 20
20 -
 21
21 -
22
-
23
-
24
-
25
-
26
-
27
-
28
-
29
-
30
-
31
-
32
-
33
-
34
-
35
-
36
-
37
-
38
-
39
-
40
-
41
-
42
-
43
 |
 |

Accounting Changes > See Note 2of the Notes to
Consolidated Financial Statements for a discussion
regarding recently issued accounting standards, includ-
ing Financial Accounting Standard No. 137, Staff
Accounting Bulletin No. 101, Emerging Issues Task
Force (“eitf”) 00-10, eitf 00-14 and eitf 00-19.
Contingencies > Although Avon has completed its
divestiture of all discontinued operations, various law-
suits and claims (asserted and unasserted) are pending or
threatened against Avon. The Company is also involved
in a number of proceedings arising out of the federal
Superfund law and similar state laws. In some instances,
Avon, along with other companies, has been designated
as a potentially responsible party which may be liable for
costs associated with these various hazardous waste sites.
In the opinion of Avon’s management, based on its review
of the information available at this time, the total cost
of resolving such contingencies at December 31, 2000
should not have a material adverse impact on Avon’s
consolidated financial position, results of operations or
cash flows.
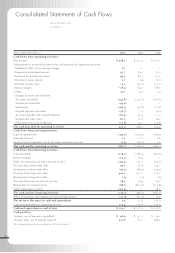
Liquidity and Capital Resources
Cash Flows > Net cash provided by operating activities
was $323.9 in 2000 compared to $448.7 in 1999. The
2000 decrease principally reflects higher working capital
levels, which primarily included increased inventory
levels and a use of cash related to accounts payable and
accrued expenses, partially offset by higher net income.
The increase in inventory was mainly due to higher sales
volume and additional stock on hand to protect service
levels. Accounts payable and accrued expenses reflected
the payout of the Company’s long-term incentive plan in
2000, as well as a decline in days in payables, to a level
that is consistent with valuable supply chain partnerships
developed in recent years.
Excluding changes in debt and other financing
activities, net cash usage of $97.1 in 2000 was $639.5
favorable compared to net cash usage of $736.6 in 1999.
The $639.5 variance primarily reflects a decrease in repur-
chases of common stock resulting from the acceleration
of the buyback program in the second half of 1999. See
Note 9of the Notes to Consolidated Financial Statements
for further discussion of the Company’s share repurchase
program. In addition, the variance was also a result of a
favorable exchange rate impact on cash and decreased cash
used for investing activities in 2000, due to the acquisi-
tion of a manufacturing facility in Poland in 1999 and
lower capital expenditures in 2000. These sources of cash
were partially offset by lower cash provided by operating
activities, discussed above, and a reduction in book over-
drafts in 2000. During 1998 and 1997, the Company
received net proceeds of approximately $58.1 and $58.6,
respectively, under securities lending transactions that
were settled in the fourth quarter of 2000 and are
included in the cash flows as other financing activities.
See Note 4of the Notes to Consolidated Financial
Statements for further discussion of these transactions.
For the period 1994 through 2000, 59.6 million
shares of common stock have been purchased for
approximately $1.51 billion under the stock repurchase
programs. See Note 9of the Notes to Consolidated
Financial Statements for further details of the share
repurchase programs.
Working Capital > At December 31, 2000, current assets
exceeded current liabilities by $186.4 while at December
31, 1999, current liabilities exceeded current assets by
$375.0. This increase of $561.4 is primarily due to
decreased net debt (short-term debt less cash and equiva-
lents), the repayment of $101.4 related to securities lend-
ing transactions that were included in other accrued
liabilities in 1999, the payout of the long-term incentive
plan in 2000 as well as the net effect of the 2000 tax
refund. In addition, higher inventory levels, as discussed
in the Inventories Section, also contributed to the variance.
Although current liabilities exceeded current assets
at December 31, 1999, management believes this is due
to the Company’s direct selling business format which
results in lower receivable and working capital levels.
Avon’s liquidity results from its ability to generate signif-
icant cash flows from operations and its ample unused
borrowing capacity. At December 31, 1999, the large
excess of current liabilities over current assets as well as
the issuance of long-term debt in 1999, discussed in Note
4of the Notes to Consolidated Financial Statements,
reflects the acceleration of the Company’s share repurchase
program. These share repurchases resulted in a sharehold-
ers’ deficit balance at December 31, 2000 and 1999, of
$215.8 and $406.1, respectively. Avon’s credit agree-
ments do not contain any provisions or requirements with
respect to working capital or equity balances.
40