Avon 2000 Annual Report Download - page 4
Download and view the complete annual report
Please find page 4 of the 2000 Avon annual report below. You can navigate through the pages in the report by either clicking on the pages listed below, or by using the keyword search tool below to find specific information within the annual report.-
 1
1 -
 2
2 -
 3
3 -
 4
4 -
 5
5 -
 6
6 -
 7
7 -
 8
8 -
 9
9 -
 10
10 -
 11
11 -
 12
12 -
 13
13 -
 14
14 -
 15
15 -
16
-
17
-
18
-
19
-
20
-
21
-
22
-
23
-
24
-
25
-
26
-
27
-
28
-
29
-
30
-
31
-
32
-
33
-
34
-
35
-
36
-
37
-
38
-
39
-
40
-
41
-
42
-
43
 |
 |

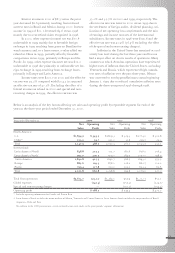
Consolidated net sales increased 7% in 2000 to
$5.67 billion from $5.29 billion in 1999. Sales in North
America increased 5% to $2.15 billion in 2000.
International sales increased 9% to $3.53 billion due to
strong growth in the Latin American and Pacific regions
and, to a lesser extent, in the European region. In 1999,
consolidated net sales of $5.29 billion increased 1% from
$5.21 billion in 1998. Sales in North America increased
1% to $2.05 billion in 1999. International sales increased
2% to $3.24 billion due to strong growth in the Pacific
region and in Europe, partially offset by declines in Latin
America. Excluding the unfavorable impact of foreign
currency translation, consolidated net sales would have
increased 11% and 9% in 2000 and 1999, respectively.
Other revenue includes shipping and handling fees
billed to Representatives and totaled $40.9, $38.8 and
$35.0 in 2000, 1999 and 1998, respectively.
Cost of sales as a percentage of net sales was 37.4%
in 2000, compared with 38.4% in 1999 and 39.4% in
1998. The 1999 and 1998 cost of sales included $46.0 and
$37.9, respectively, of non-recurring charges for inventory
write-downs related to the Company’s bpr program. The
charges related to the closure of facilities, discontinuation
of certain product lines, size-of-line reductions and a
change in strategy for product dispositions. See Note 13
of the Notes to Consolidated Financial Statements for fur-
ther discussion of these charges. Excluding the charges,
cost of sales as a percentage of sales was 37.5% in 1999
versus 38.7% in 1998.
In 2000, the favorable gross margin variance versus
1999 was due to improvements in all international
regions, most significantly in the Pacific region, includ-
ing Japan and China, as well as Central and Eastern
Europe, due to lower product costs on imports from euro
countries coupled with a shift in mix to higher margin
products, and in Russia, due to a favorable comparison
resulting from a discount pricing policy in 1999. Gross
margins remained level with prior year in Brazil and the
u.s. These improvements were partially offset by declines
in Puerto Rico, due to inventory variations related to
the consolidation of operations, and in Mexico and the
Philippines, resulting from higher sales of a lower margin
mix of cosmetics, fragrance and toiletries (“cft”) products
and selective price cuts to meet competition.
In 1999, the favorable gross margin variance versus
1998 was due to improvements in all regions, most sig-
nificantly in Europe, including the United Kingdom,
Germany, Italy and Central Europe, due to a continuing
focus on pricing strategies and improved profitability of
Beauty Plus categories, including fashion jewelry and
accessories. Japan, Mexico and the u.s. also posted strong
gross margin improvements. These improvements were
partially offset by a decline in Brazil, resulting from
higher costs in the second half of 1999 as a result of a
major currency devaluation, and in Russia, due to a pric-
ing discount policy begun in the fourth quarter of 1998.
Marketing, distribution and administrative
expenses of $2.80 billion increased $161.4, or 6%, over
prior year, but decreased as a percentage of total revenue
to 49.1% from 49.6% in 1999. The overall improvement
in the expense ratio was due to a favorable expense ratio
in Mexico, resulting from lower marketing and promo-
tional expenses associated with product introductions, in
Russia, due to strict expense controls as well as favorable
comparisons against prior year, and in the Philippines
and China, reflecting fixed administrative expenses on a
higher sales base. Expense ratio improvements were par-
tially offset by higher expenses in Argentina, reflecting
increased advertising and brochure costs, in the United
Kingdom, due to increased shipping and distribution
costs from decreased capacity of shipping lines during
transition to a new system, and in Puerto Rico, reflecting
higher transitional expenses related to the consolidation
of operations.
Marketing, distribution and administrative
expenses of $2.64 billion in 1999 increased $36.8, or 1%,
over 1998, but remained level as a percentage of total
revenue versus 1998. Expense ratio improvements were
reported in Brazil reflecting strict expense management
and bpr initiatives, in Japan reflecting bpr efforts, and in
Central Europe reflecting volume efficiencies and a signif-
icant reduction in expenses. These improvements were
offset by higher expense ratios in Mexico due to increased
advertising and incentive programs in 1999, in Germany
due to strategic marketing investments, in Venezuela
due to increased incentive programs and in the United
Kingdom due to higher shipping expenses, most signifi-
cantly in the fourth quarter of 1999.
Interest expense increased $41.5 in 2000 to $84.7
and $8.5 in 1999 to $43.2. The increases in both 2000
and 1999 are primarily the result of increased domestic
borrowings related to the acceleration of the Company’s
share repurchase program, which occurred in the second
half of 1999, and working capital requirements.
34