Avon 2000 Annual Report Download - page 36
Download and view the complete annual report
Please find page 36 of the 2000 Avon annual report below. You can navigate through the pages in the report by either clicking on the pages listed below, or by using the keyword search tool below to find specific information within the annual report.-
 1
1 -
2
-
3
-
4
-
5
-
6
-
7
-
8
-
9
-
10
-
11
-
12
-
13
-
14
-
15
-
16
-
17
-
18
-
19
-
20
-
21
-
22
-
23
-
24
-
25
-
 26
26 -
 27
27 -
 28
28 -
 29
29 -
 30
30 -
 31
31 -
 32
32 -
 33
33 -
 34
34 -
 35
35 -
 36
36 -
 37
37 -
 38
38 -
 39
39 -
 40
40 -
 41
41 -
 42
42 -
 43
43
 |
 |

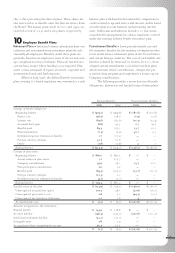
11Segment Information
The Company’s reportable segments are based on geo-
graphic operations and include a North American busi-
ness unit and International business units in Latin
America, Europe and Pacific regions. The segments have
similar business characteristics and each offers similar
products through common customer access methods.
The accounting policies of the reportable segments
are the same as those described in Note 1of the Notes to
Consolidated Financial Statements. The Company evalu-
ates the performance of its operating segments based on
operating profits or losses. Segment revenues reflect direct
sales of products to Representatives based on their geo-
graphic location. Intersegment sales and transfers are not
significant. Each segment records direct expenses related
to its employees and its operations. The Company does
not allocate income taxes, foreign exchange gains or
losses, or corporate overhead expenses to operating
segments. Identifiable assets are primarily those directly
used in the operations of each segment. Corporate and
other identifiable assets include cash, investments,
deferred tax assets and prepaid pension assets.
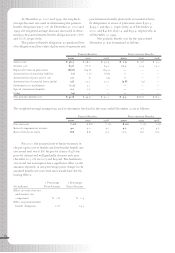
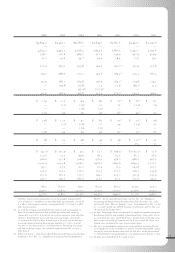
Summarized financial information concerning
the Company’s reportable segments as of December 31 is
shown in the following table. Net sales and operating
profit by reportable segment are presented on page 35.
Total Assets: 2000 1999 1998
North America
u.s. $ 640.0 $ 536.9 $ 497.2
Other* 128.2 114.5 111.1
Total 768.2 651.4 608.3
International
Latin America North 292.9 248.9 205.3
Latin America South 310.7 294.1 338.1
Latin America 603.6 543.0 543.4
Europe 451.3 415.4 386.0
Pacific 399.8 411.2 379.5
Tota l 1,454.7 1,369.6 1,308.9
Corporate and other 603.5 507.6 516.3
Total assets $2,826.4 $2,528.6 $2,433.5
Capital Expenditures: 2000 1999 1998
North America
u.s. $ 67.6 $ 39.2 $ 32.1
Other* 8.7 9.1 8.6
Tota l 76.3 48.3 40.7
International
Latin America North 17.5 37.6 17.5
Latin America South 24.6 15.8 19.1
Latin America 42.1 53.4 36.6
Europe 47.1 39.6 28.8
Pacific 13.4 33.6 28.1
Total 102.6 126.6 93.5
Corporate and other 14.6 28.5 55.3
Total capital expenditures $ 193.5 $ 203.4 $ 189.5
Depreciation and Amortization: 2000 1999 1998
North America
u.s.$ 28.5 $ 23.7 $ 19.2
Other* 3.5 2.8 2.4
Total 32.0 26.5 21.6
International
Latin America North 9.3 6.4 5.1
Latin America South 7.4 6.6 6.9
Latin America 16.7 13.0 12.0
Europe 16.0 15.4 14.9
Pacific 16.9 16.1 11.2
Total 49.6 44.5 38.1
Corporate and other 15.5 12.0 12.3
Total depreciation
and amortization $ 97.1 $ 83.0 $ 72.0
Long-Lived Assets: 2000 1999 1998
North America
u.s. $ 283.1 $ 251.6 $ 215.9
Other* 25.3 17.2 23.9
Total 308.4 268.8 239.8
International
Latin America North 81.5 73.7 47.2
Latin America South 73.4 59.7 62.1
Latin America 154.9 133.4 109.3
Europe 175.4 152.9 135.0
Pacific 174.6 193.1 167.1
Total 504.9 479.4 411.4
Corporate and other 146.5 140.7 153.9
Total long-lived assets $ 959.8 $ 888.9 $ 805.1
* Includes operating information for Puerto Rico, Canada and
Discovery Toys.
The following table presents consolidated net sales
by classes of principal products, as of December 31:
2000 1999 1998
Cosmetics, fragrance and
toiletries $3,501.3 $3,220.8 $3,181.1
Beauty Plus:
Fashion Jewelry 323.4 313.4 294.5
Accessories 275.8 223.9 222.4
Apparel 476.3 474.5 469.1
Watches 68.6 49.8 42.1
1,144.1 1,061.6 1,028.1
Beyond Beauty and Other* 1,028.3 1,006.7 1,003.5
Total net sales $5,673.7 $5,289.1 $5,212.7
* Beyond Beauty and Other primarily includes home products, gift and deco-
rative, health and nutrition, and candles.
66