Avon 2000 Annual Report Download - page 41
Download and view the complete annual report
Please find page 41 of the 2000 Avon annual report below. You can navigate through the pages in the report by either clicking on the pages listed below, or by using the keyword search tool below to find specific information within the annual report.-
 1
1 -
2
-
3
-
4
-
5
-
6
-
7
-
8
-
9
-
10
-
11
-
12
-
13
-
14
-
15
-
16
-
17
-
18
-
19
-
20
-
21
-
22
-
23
-
24
-
25
-
26
-
27
-
28
-
29
-
30
-
 31
31 -
 32
32 -
 33
33 -
 34
34 -
 35
35 -
 36
36 -
 37
37 -
 38
38 -
 39
39 -
 40
40 -
 41
41 -
 42
42 -
 43
43
 |
 |

71
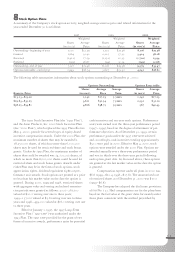
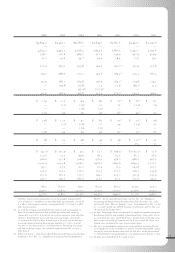
therefore, year-over-year comparisons are not meaningful. Approximately
25% of Avon’s u.s. employees are men. Men hold approximately 15% of all
u.s. officer and manager positions, and approximately 10% of all u.s. office
and clerical positions.
(8) In 1998, Avon began a worldwide business process redesign program in
order to streamline operations and recorded special and non-recurring
charges of $154.4 ($122.8 net of tax, or $.46 per share on a basic and dilut-
ed basis). Excluding the special and non-recurring charges, net income
in 1998 increased 16 % to $392.8 from $338.8. In 1999, special and non-
recurring charges related to this program totaled $151.2 ($121.9 net of
tax, or $.47 per share on a basic and diluted basis). Excluding the special
and non-recurring charges, net income in 1999 increased 8% to $424.3
from $392.8.
(9) Effective January 1, 1994, Avon adopted Statement of Financial Accounting
Standards (“fas”) No. 112, “Employers’ Accounting for Postemployment
Benefits”, for all applicable operations, and fas No. 106, “Employers’
Accounting for Postretirement Benefits Other Than Pensions”, for its for-
eign benefit plans. Effective January 1, 1993, Avon adopted fas No. 106 for
its u.s. retiree health care and life insurance benefit plans and fas No. 109,
“Accounting for Income Taxes.”
(10) In 1992, Avon began the restructuring of its worldwide manufacturing and
distribution facilities and recorded a provision of $96.0 ($64.4 after tax, or
$.22 per share on a basic and diluted basis). Income from continuing opera-
tions in 1993 increased 4% from $228.6, or $.79 per share on a basic and
diluted basis, excluding the 1992 restructuring charge.
(11) For 1991, in management’s opinion, per share amounts assuming dilution,
even though the result is antidilutive, provide the most meaningful compar-
ison of per share data because they show the full effect of the conversion of
72 preferred shares into approximately 51.84 common shares on June 3, 1991.
(12) Includes special dividend of $.75 paid in 1991.
1996 1995 1994 1993 1992 1991 1990
$4,814.2 $4,492.1 $4,266.5 $3,844.1 $3,660.5 $3,441.0 $ 3,291.6
———————
4,814.2 4,492.1 4,266.5 3,844.1 3,660.5 3,441.0 3,291.6
538.0 500.8 489.5 427.4 339.9 430.9 409.9
33.2 34.6 44.7 39.4 38.4 71.6 74.1
510.4 465.0 433.8 394.6 290.0(10) 352.9 305.6
319.0 288.6 270.3 243.8 169.4(10) 209.3 180.3
317.9 286.1 264.8 236.9 164.2(10) 204.8 174.1
— (29.6) (23.8) 2.7 10.8 (69.1) 21.2
— — (45.2)(9) (107.5)(9) ———
317.9 256.5 195.8 132.1 175.0(10) 135.7 195.3
$ 1.19 $ 1.05 $ .94 $ .82 $ .57(10) $.65
(11) $.61
— (.11) (.09) .01 .04 (.24) .09
— — (.16) (.37) — — —
1.19 .94 .69 .46 .61(10) .41(11) .70
$ 1.18 $ 1.05 $ .93 $ .82 $ .57(10) $ .71(11) $.58
— (.11) (.08) .01 .04 (.24) .07
— — (.16) (.37) — — —
1.18 .94 .69 .46 .61(10) .47(11) .65
$ .58 $ .53 $ .48 $ .43 $ .38 $ 1.10(12) $ .25
———— — .253 .50
$ (41.7) $ (30.3) $ 9.3 $ 23.1 $ (99.5) $ (135.3) $ 71.6
103.6 72.7 99.9 58.1 62.7 61.2 36.3
566.6 537.8 528.4 476.2 476.7 468.5 467.2
2,222.4 2,052.8 1,978.3 1,918.7 1,692.6 1,693.3 2,010.1
97.1 47.3 61.2 70.4 37.3 143.8 207.1
104.5 114.2 116.5 123.7 177.7 208.1 334.8
201.6 161.5 177.7 194.1 215.0 351.9 541.9
241.7 192.7 185.6 314.0 310.5 251.6 393.4
7,800 8,000 7,900 8,000 8,700 9,200 9,500
25,900 23,800 22,500 21,500 20,700 20,900 20,300
33,700 31,800 30,400 29,500 29,400 30,100 29,800